Another day, another poll showing that fewer Americans believe climate change is real.
Results from the latest Gallup Social Series Environment poll show that concern about global warming continues to wane, in some areas dipping to levels as low as when Gallup first started surveying about climate change in 1997. The poll was conducted last week (between March 4 and March 7) and included responses from telephone interviews (land lines and cell phones) with 1,014 individuals 18 and older.
Key results include:
19 percent say that effects of climate change “will never happen.” That compares with 16 percent last year and a low of 7 percent in 2001.
Almost half of Americans say most scientists are either unsure if global warming is happening (36 percent) or that most scientists believe that it is not happening (10 percent). Just 52 percent think most scientists “believe it is occurring,” down from 65 percent last year.
The poll showed a near-even split between those who think global temperature increases are due to human activity (50 percent) as opposed to natural causes (46 percent). That’s the lowest percentage to blame warming on human activity since Gallup first asked the question in 2003 and a drop of 8 percent from last year.
48 percent said that news reports about climate change are “generally exaggerated” compared with 40 percent last year and 30 percent in 2006 and 2001.
The Gallup results mirror a recent study by Yale and George Mason universities called “Global Warming’s Six Americas.” The report found that the number of Americans who believe global warming is not happening has risen from 8 percent to 16 percent since 2008.
According to Gallup, the study results over the last two years mark a reversal in American attitudes about climate change. Their data shows that concerns had increased from 1997 for over a decade, but in 2009 public concern retreated, and this year’s survey results mark an even more pronounced downtown.
As we have reported, this shift in attitudes may reflect recent publicity about mistakes in the 2007 IPCC report and the emails hacked and disseminated from the accounts of East Anglia climate scientists. The record-breaking cold and snow in some parts of the country this year also could have played a role as well as the increasingly politicized nature of the debate.
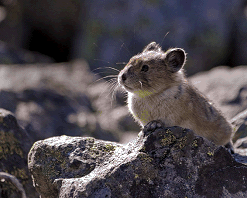
American Pika are living at lower elevations and surviving warmer temperatures than previously thought, according to a paper in the journal Arctic, Antarctic, and Alpine Research (available for download at the US Forest Service Pacific Southwest Research Station’s site).
One of the authors, Connie Millar, said she saw pika far more often and in a broader elevation range than she had expected she would. Millar, a Forest Service ecologist, found all those pika using a method she developed to quickly determine if pika are living in places where one would expect to find them.
Pika, cute little rabbit relatives that live in high elevations throughout the West, have been in the news lately. The Center for Biological Diversity (CBD) petitioned for the pika to be listed under the federal Endangered Species Act in 2007, citing climate change as a threat to survival of the cold-adapted species. Last month, under a new administration, the U.S. Fish and Wildlife Service decided not to protect the pika, explaining that though some populations do seem to be in trouble, most are doing fine so far. (Climate Watch has followed the pika story; see previous posts here, here, and here).
This newest study would seem to support the federal decision. But Shaye Wolf, staff biologist with the CBD, says that though the study “provides a snapshot of where pika are now, long-term in-depth studies have found that pika populations are declining.”
The majority of those declining populations are in Nevada’s Great Basin, at relatively low elevations for pika colonies. One paper Wolf cites was recently published in Ecological Applications. Authors Erik Beever and Chris Ray concluded that shrinking pika populations in the Great Basin could be partially attributed to climate change. Pika have an extremely narrow band of temperature tolerance and can suffer heat stroke in temperatures comfortable to humans.
Wolf and Millar are both members of the California Pika Consortium, a newly formed research group. Millar plans to distribute her pika survey to colleagues in the consortium in order to continue gathering data on locations of pika colonies.
Meanwhile, even though the Fish and Wildlife Service has denied federal protection to the pika, CBD is still working on gaining state-level protection in California. CBD biologists consider the pika to be a bellwether species for climate change.
San Francisco’s Franklin Square Park (Photo: Gretchen Weber)
One of my favorite things about living in San Francisco is that springtime starts in February. A month, which, when I was growing up in New England, was the grayest, worst month of all.
But here, walking down the street outside KQED last week, I could smell the blossoms on the budding trees. Sometimes you can even hear the birds chirping over the sounds of buses pulling in and out of the MUNI yard across the street.
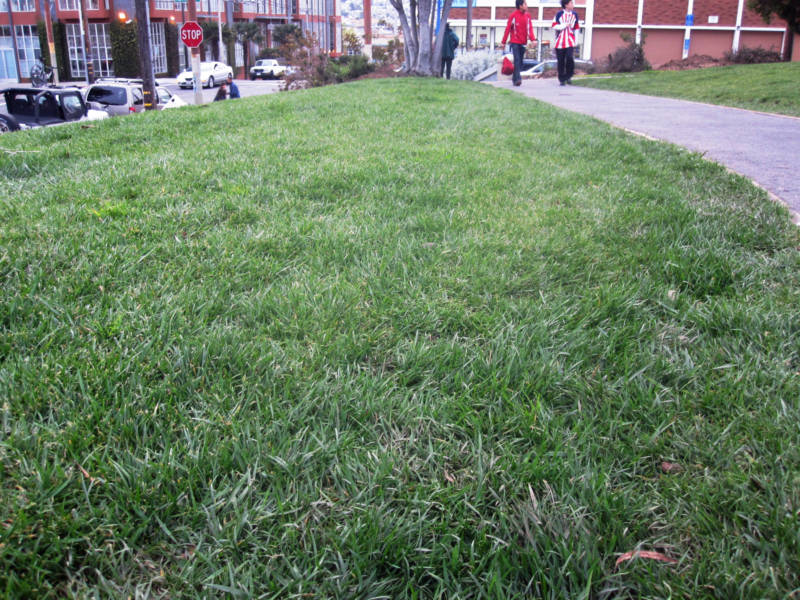
One block away from the station, there’s a public park. The turf grass there has been pretty green all year (something that was certainly not true of the parks from my childhood.) Walking by the park and its lush green lawn the other day, I was reminded of an argument I’ve been having with my mother for about 20 years: Just because its green, and it’s grass, that doesn’t mean it’s good, Mom. Okay, maybe it’s visually good, if you go for a certain aesthetic, but a perfectly manicured lawn, green as it may be, isn’t necessarily good for the planet. And I’m not just talking about the visits that ChemLawn paid to my childhood home every summer.
Yes, there’s the water issue. In California, we could still be staring into our fourth year of drought (mostly from cumulative effects of the past three years), and there’s been a lot of talk about how much water traditional lawns eat up. There are advocates for growing native plants in front of your house instead of turf grass for that very reason.
But a recent report takes the lawn debate beyond water. In the study, researchers from UC Irvine found that ornamental turf grass actually produces more greenhouse gases than it absorbs, once you factor in emissions from irrigation, fertilization, and mowing. Plants naturally remove CO2 from the air as part of photosynthesis, and so lawns and parks have often been thought of as carbon “sinks,” that is having a net negative effect on atmospheric CO2 levels. But that may be because most studies haven’t factored “lawn care” into the equation.
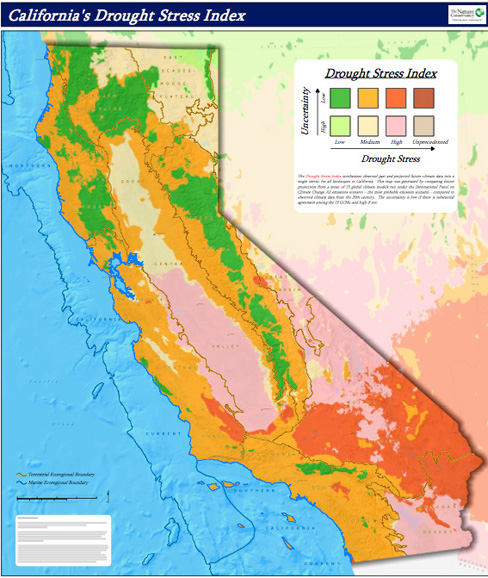
Projected drought conditions for 2070-2100 (Map: The Nature Conservancy)
Climate change is causing conservationists to rethink traditional methods of protecting lands and ecosystems. The conventional strategy of setting aside a specific parcel of land (and increasingly, ocean) to protect a particular community of organisms may no longer be sufficient in a rapidly changing climate. While greenhouse gas reduction and climate change mitigation remains a top priority for most conservationists, land managers have begun developing adaptation strategies that take the effects of a warming planet into account.
“We have a fantastic conservation success story in having conserved a huge network of protected areas,” says Healy Hamilton, director of the Center for Applied Biodiversity Informatics at the California Academy of Sciences. “The issue with those protected areas is that they all have static boundaries around them and they work to protect what lies within them, So the plants and animals that are there are well-protected, as long as they stay there.” Trouble is, the habitat isn’t staying put.
Climate has “Velocity”
The world’s ecosystems will need to move about a quarter of a mile each year to keep up with climate change, according to a recent study published in Nature (link is to the first paragraph of the paper; the full article is only available to subscribers, but you can read a press release about the about the study).
Researchers from the Carnegie Institution, Stanford, the California Academy of Sciences, and UC Berkeley collaborated on the paper, which describes climate belts sweeping north and south from the equator–and also moving uphill–as the world warms.
Hamilton, who co-authored the study, told a packed house at the Center for Biological Diversity in January, that “Climates are on the move. It’s not just a slow unfolding, it’s a radical, abnormal process. Everywhere we look, shifts are already occurring.”
And under these changing conditions, she said, plants and animals have three choices: “They can stay and adapt, they can shift with their climate, or they can go locally extinct if they can’t move fast enough.”
The study’s lead author, Scott Loarie, a fellow at the Carnegie Institution, explains that climate change forecasts are commonly measured in degrees per year, but the authors of this study wanted to know how those temperature changes would affect what can live where. So they used temperature “velocity” (in kilometers per year) to measure how fast regional climate conditions are moving as the planet heats up.
It turns out that the belts move at different rates, depending on the landscape. In the Amazon Basin, velocity is relatively high. It’s a large and homogeneous ecosystem, so as the temperature changes there, plants and animals will have to travel a long way to keep up with the climate in which they’ve evolved to thrive. In a place like California, with its microclimates and variable topography, the velocity is lower. Some species may need merely to migrate to a nearby north-facing–and therefore cooler–slope. Others will have to head north and toward the coast. Climate models forecast that eventually the Bay Area will look more like Southern California, and the Bay Area’s current climate will be located somewhere north of us.
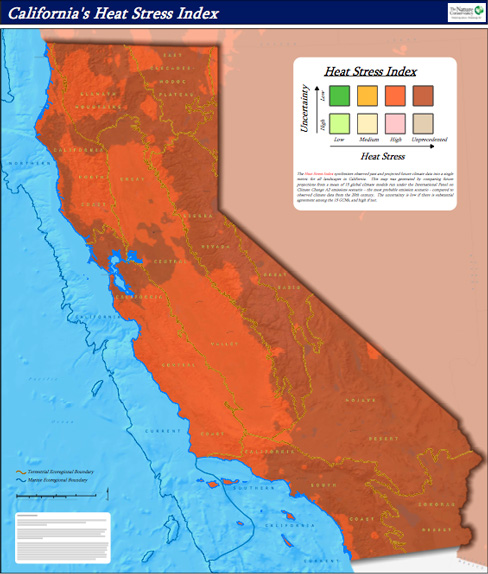
Projected Heat Stress in California for 2070-2100 (Map: The Nature Conservancy)
Mapping a Moving Climate
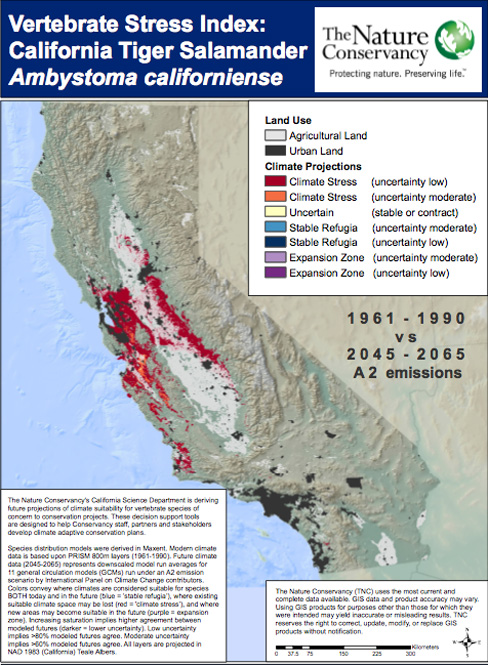
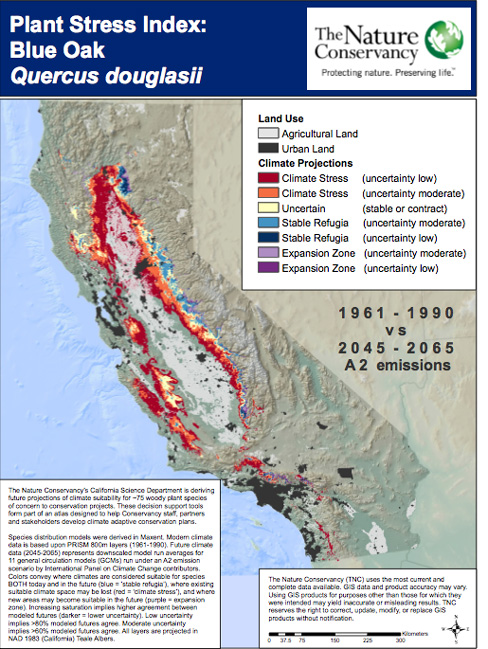
The Nature Conservancy of California has attempted to map some of these trends (see above and below). Scientists averaged together several different climate models to create a picture of California’s future in terms of temperature and precipitation. They then applied that projection to habitats for specific species, to make predictions about how ranges may shift. The maps show both how much areas are likely to change, as well as how certain the predictions are.
“What we’re trying to understand is how does the way we protect species in the future need to change with a changing climate,” says Rebecca Shaw, Director of Conservation for the Nature Conservancy of California. “The kind of strategies you employ and how much you spend is really going to be dependent on how certain you are about change in the future.”
For example, she says some parts of the Sierra are not likely to change very much over the next century, but some places like the Mojave Desert are expected to change a great deal. That kind of information could be useful for land managers trying to plan for the future. For example, in areas that are expected to undergo great change, it might be more important to preserve corridors, or connecting stretches of protected lands, so that populations can move as the climate changes, if they are unable to adapt where they are.
Loarie says “assisted migration”–helping specific species move to new locations–is expensive, unpredictable, and unrealistic. Instead, he, too, corridors for plants and animals to safely follow their climate–if they can keep up. Species like the American pika, already living on mountaintops, can’t go any farther uphill. Their habitats could disappear completely, or, as Loarie says, “they’ll pop off the top.”
There are limitations to the predictions one can make with temperature velocity measurements. What temperature changes will do to fog, for instance, is still unknown, so it’s not clear yet where the redwoods will need to move in the next 100 or so years.
To enable the second option, Hamilton agrees with Loarie. she says the conservation community needs to rethink its traditional strategy of protecting lands. Instead of protecting specific parcels of land and expecting them the stay the same over time, conservationists need to expect change, and to create connectivity in the landscape so that species can move when and if they need to.
Projected changes in California Salamander habitat (Map: The Nature Conservancy)Projected changes in California Blue Oak habitat (Map: The Nature Conservancy)
One of six possible profile "badges" from KQED's Matter of Degree Facebook survey
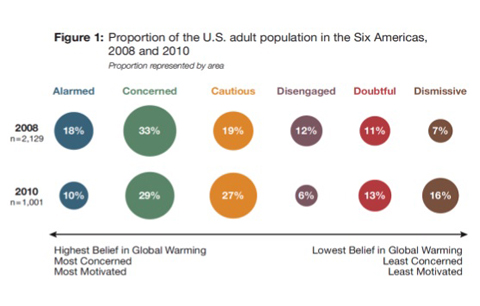
The percentage of Americans who believe that global warming is not happening has doubled since 2008, climbing from eight to 16 percent of the adult population, according to a new report from Yale and George Mason Universities. (The full report is available as a PDF on the Yale Project on Climate Change website.)
More than 1,000 adults were surveyed in late December and early January, and their responses compared with results from a similar survey in the fall of 2008. Called “Global Warming’s Six Americas,” the study identifies six “types” of attitudes about climate change ranging from “Alarmed” to “Dismissive” (see diagram, below).
The updated research finds that while the percentage of “Dismissives” is growing, the proportion of people at the opposite end of the spectrum, the Alarmed, is shrinking. The percentage of Americans who believe that climate change is real, is caused by humans, and is an immediate threat, has dropped to 10 percent of the population, down from 18 percent in 2008. The survey group described as “Concerned” has, however grown slightly, and the “Disengaged” portion has halved, which would seem to indicate more people staking out positions on one side or the other.
Study author and director of the Yale Project on Climate Change, Anthony Leiserowitz, cited “gloomy unemployment numbers, public frustration with Washington, attacks on climate science, and mobilized opposition to national climate legislation” as contributing to diminished public concerns about global warming.
As we reported earlier this month, despite a drop in concern about climate change, majorities in all six groups say that developing sources of clean energy should be a priority for the US government.
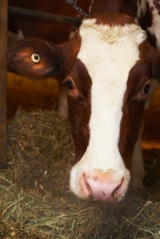
A couple of months ago, nearly lost amid the “Hopenhagen” hype, the University of California, Davis (UCD) put out a press release with an admonition: “Don’t Blame Cows for Climate Change.” The release was a first look at some work conducted by UCD Associate Professor and Air Quality Specialist Frank Mitloehner. His study examines the greenhouse gases, or GHGs, emitted by the livestock sector. As California’s air regulators turn more attention toward methane in particular, the report remains timely.
Mitloehner’s paper is entitled: “Clearing the Air: Livestock’s Contributions to Climate Change,” and was published in the peer-reviewed journal Advances in Agronomy. The paper is a synthesis of current science on the cattle-climate connection. Mitloehner has been updating some of that science in recent years.
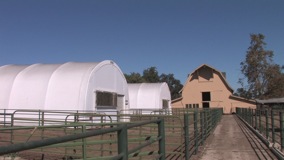
In 2008, I stopped by his cluster of “bio bubbles;” airtight domes that serve as high-tech stables for cows. Inside, Mitloehner had set up simulated dairy operations, measuring GHGs emitted by the cows’ digestive process and decomposition of the manure. The numbers then in common use had been generated in the 1930s.
Research "bio-bubbles" at UC Davis. Photo: Cody Sheehy
Mitloehner says cattle gets a bum rap in the media, and points to some examples, including a 2007 story in Time magazine, which included assertions like: “Which is responsible for more global warming: your BMW or your Big Mac? Believe it or not, it’s your Big Mac,” and “A 16-oz T-bone is like a hummer on a plate . . ”
In many cases, Mitloehner says the statements are crafted from an influnencial 2006 United Nations report entitled: “Livestock’s Long Shadow.” According to the executive summary, “The livestock sector is a major player, responsible for 18 percent of greenhouse gas emissions measured in CO2 equivalent. This is a higher share than transport.”
But Mitloehner points to a quote deeper in the report:
“The respiration of livestock makes up only a very small part of the net release of carbon that can be attributed to the livestock sector. Much more is released indirectly by other channels, including: the burning of fossil fuel to produce mineral fertilizers used in feed production, methane release from the breakdown of fertilizers and from animal manure, land-use changes for feed production and for grazing, land degradation, fossil fuel use during feed and animal production and fossil fuel use in production and transport of processed and refrigerated animal products.”
Mitloehner cautions that the transportation number they use only accounts for tailpipe emissions. To be even-handed, he says, the authors should’ve incorporated emissions from the entire oil industry, including refinement of the oil and production of cars. In the UCD release, Mitloehner calls it a “lopsided ‘analysis” and “a classical apples-and-oranges analogy that truly confused the issue.”
Meanwhile, the Bio-bubbles have been generating some interesting numbers. Mitloehner found that the amount of methane the cows respire (belch) and how much is released in the breakdown of animal manure is quite different from what previous research had calculated. In combination, these two sources represent the most direct GHGs from the livestock industry, even if they’re not the largest GHG emitter associated with the industry. They’re also the most out of date.
Emission factors used in “Livestock’s Long Shadow” provide an estimate of methane respiration of about 86 million tonnes (metric tons) of methane (CH4) and 17.5 million tonnes of CH4 annually from manure decomposition. In the annex of the UN report, the authors write: “Obviously, great improvements to the estimates of emission factors could be made if more data on nutrition and production were available.” And so it is that inside his bio-bubbles, Mitloehner has come up with numbers much lower than those that represented the conventional wisdom since 1938.
All in all, we’ve got a discussion about comparing apples and oranges (more appealing than manure, granted) and some updated numbers that lower the emissions of livestock in one category. As with any scientific paper, there will probably be debate on both of these points and new ones, but let’s look at the broader consequences. Will industry look at this study and see an incentive to update and revise carbon emission numbers all across the board?
According to Emilo Laca, an agricultural ecologist at U. C. Davis, some of these questions will be fodder for policy debates that lie outside the realm of science. He says “The real question is, ‘How are we going to split this up?'” Laca used a hypothetical problem to explain: Let’s say that a certain livestock industry consumed 30% of soybean production as a food source. Livestock producers might concede that they should be accountable for 30% of carbon emissions related to soybeans. It makes sense. It’s what the numbers say. Others might counter that without this certain livestock industry, the soybean market would behave differently and some amount–lets guess 70%–wouldn’t need to be planted. Therefore, the livestock industry in this example is responsible for 70% of the emissions, not 30%. Science can support both interpretations. As Laca says, the decision is how to “split” things up. And ultimately, those decisions may fall to policy wonks.
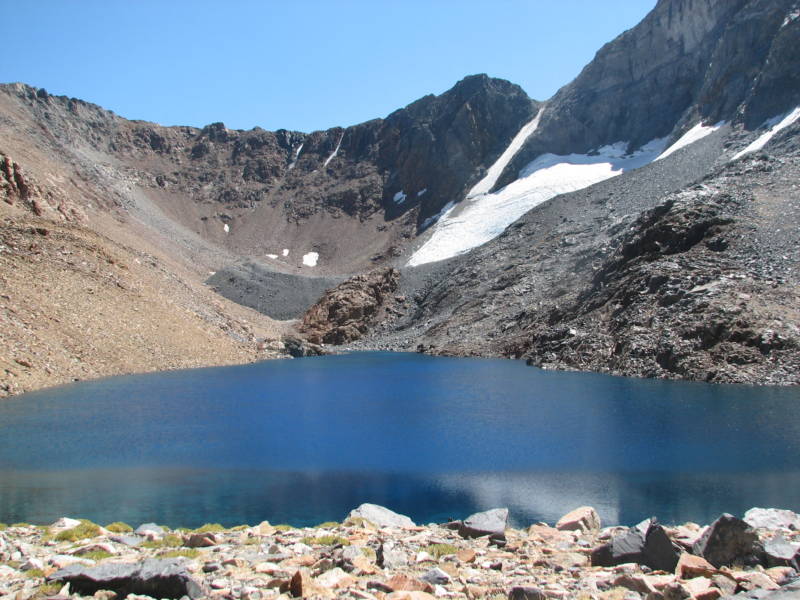
The Dana Glacier, outside Yosemite, CA. Photo: Gretchen Weber
Yet another climate controversy has revived what have become increasingly common attacks on scientists’ credibility. The latest flap arose when the IPCC admitted on Wednesday, that its 2007 prediction that Himalayan glaciers could melt away by 2035 was unfounded.
Attacks on the integrity of scientists have brought about a “loss of innocence” in the climate science field, said Ben Santer, a Research Scientist for Climate Model Diagnosis and Intercomparison at Lawrence Livermore National Laboratory.
On a conference call with reporters Wednesday, Santer lamented that “Fourteen or fifteen years ago, it was possible to do science and not be too worried about being the subject of Congressional investigations, Freedom of Information Act requests, and very personal and very public attacks. Those innocent days are over now.”
Santer, who’s been a key author of some IPCC reports, said the science that goes into those reports is the most rigorous that he’s seen in his career.”If your research suggests that humans are having a pronounced effect on climate,” he continued, “I think the expectation is that you will be subjected to tremendous scrutiny. And some of that is appropriate, certainly in terms of the science and the integrity and credibility of the science, but unfortunately, that scrutiny is moving to very unwelcome areas, and it’s also focusing on individuals and motives, and all of this stuff is very distasteful,” he said.
Santer was joined on the call by Lonnie Thompson, a glaciologist at Ohio State University’s Byrd Polar Research Center , who raised concern that the intense and personal nature of much of the criticism climate scientists have been facing (most recently in response to the East Anglia hacked email incident, now widely known as “Climategate”) may be keeping promising young scientists out of the field at a time when they are most needed. In the wake of the East Anglia emails, a blizzard of accusations of data manipulation blew through the blogosphere and in certain corners of the Senate.
“It does make it difficult to bring young scientists into the field,” Santer agreed. They look at what has gone on and there is genuine concern there. They must be asking themselves, ‘Do I really want to get involved in critical but possibly contentious issues if there is the possibility that I will spend months or even longer dealing with questions not about the science that I have done, but about my own personal integrity?'” said Santer.
Thompson affirmed that while it’s difficult to put a specific timetable on the disappearance of glaciers, the scientific evidence documenting glacier recession is overwhelming. Research indicates that more than 90% of the world’s glaciers are receding, he said, including approximately 95% of the glaciers in the Himalayas.
“Glaciers do not have any political agenda,” said Thompson. “They just sum up what’s happening in the environment and they retreat or react to that en masse.”
UPDATE 1/25/10
The London tabloid, the Daily Mail, reported yesterday that a lead author of the Asia chapter of the IPCC’s 2007 assessment admitted that he knew the 2035 claim was unsubstantiated, but he approved including it in the report anyway. Murari Lal reportedly said in an interview with the Daily Mail that he knew the 2035 number came from a report that was not peer-reviewed, but that the claim of imminently disappearing glaciers would, “impact policy-makers and politicians and encourage them to take some concrete action.”
Michael Schlesinger, a professor of Atmospheric Sciences and director of the Climate Research Group at the the University of Illinois at Urbana-Champaign responded to the Daily Mail report with dismay.
“I am greatly saddened and deeply offended by this person’s behavior,” he wrote in an email. “A scientist does not lie nor change the facts to suit an agenda. Rather s/he tells it as it is, as best as it is known to her/him.”
[Lal] He said these were “the most vilest allegations” and denied that he ever made such assertions. He said “I didn’t put it [the 2035 claim] in to impress policymakers…. We reported the facts about science as we knew them and as was available in the literature.”
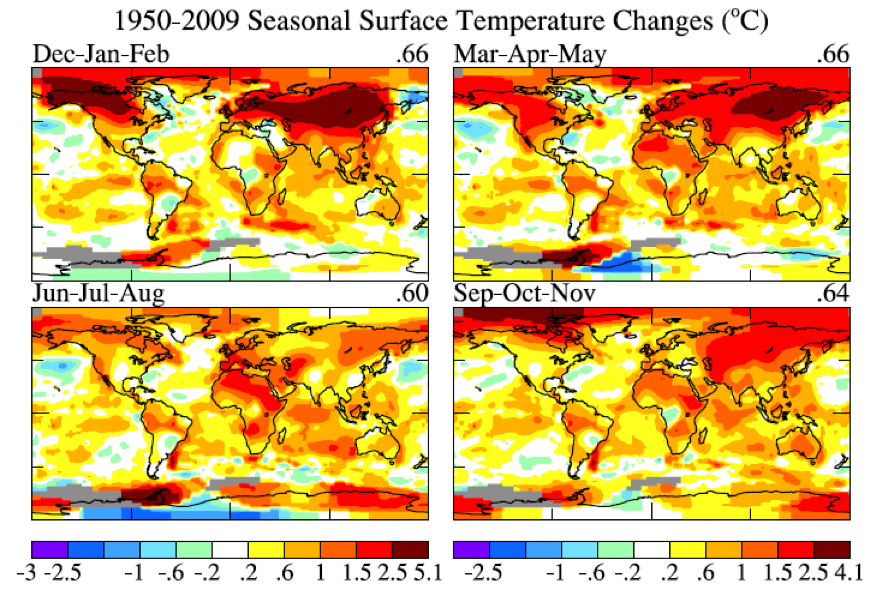
Parts of the northern hemisphere may have had an extremely cold December, but nevertheless, last year tied for the second-warmest in 130 years of global instrumental temperature records, according to the latest surface temperature analysis of the NASA Goddard Institute for Space Studies (GISS). The analysis finds that global temperatures were so similar in 1998, 2002, 2003, 2006, 2007, and 2009, that they are all tied for second place. In the Southern Hemisphere, 2009 set the record as the warmest year, according to this report.
– The scientists offer an explanation for an apparent data discrepancy over whether 1998 or 2005 was the warmest year. In short, it comes down to the difference in the way GISS and HadCRUT (Hadley Centre/University of East Anglia Climatic Research Unit) assign or do not assign temperature data for areas without observing stations. (HadCRUT leaves them out of the analysis, while GISS assigns values based on various factors outlined in the summary.) GISS maintains that 2005 was the warmest year.
– According to the report:
“There were strong negative temperature anomalies at middle latitudes in the Northern Hemisphere, as great as ‐8°C in Siberia, averaged over the month. But the temperature anomaly in the Arctic was as great as +7°C.”
In other words, 2009’s cold December in certain areas of the planet, as well as an unusually cold 2009 summer in the United States and Canada, do not reflect overall global temperatures nor signal a cooling trend:
“It is obvious that in December 2009 there was an unusual exchange of polar and mid‐latitude air in the Northern Hemisphere. Arctic air rushed into both North America and Eurasia, and, of course, it was replaced in the polar region by air from middle latitudes. The degree to which Arctic air penetrates into middle latitudes is related to the Arctic Oscillation (AO) index, which is defined by surface atmospheric pressure patterns…”
According to GISS data, December 2009 was the most extreme negative Arctic Oscillation since the 1970s.
– The report underscores that monthly temperature anomalies tend to be greater than seasonal anomalies and that the the mean temperature of a particular month might not be the best way to identify global warming. Instead, one needs to look at measurements over the long-term, which, according to GISS data, indicate general warming over at least the last 50 years, just about everywhere on the planet.
The summary concludes with a sort of admonishment:
“The bottom line is this: there is no global cooling trend. For the time being, until humanity brings its greenhouse gas emissions under control, we can expect each decade to be warmer than the preceding one. Weather fluctuations certainly exceed local temperature changes over the past half century. But the perceptive person should be able to see that climate is warming on decadal time scales.”
I’ve been pondering a 3,000 year old mystery that makes me uneasy about our current plight. Starting around 2,000 B.C., people in the Great Basin and Mojave Desert really got into big-game hunting. We see this in the archaeological record—all of this big-horn sheep and antelope bone shows up in larger quantities. Up in the mountains, great panels of rock art are chock full of hunters chasing sheep, and evidence of their hunting camps is tucked in shelters and around springs.
Big-game hunting isn’t that efficient. You’re better off going for a wide range of edibles close by. You get more food for less work. This is an important point, because after 3,000 years of this big game hunting, this culture died out, and was replaced by folks that hunted and collected a broader range of food.
Bill Hildebrandt and Kelly McGuire, two archaeologists from Far Western Anthropological Research Group in Davis, have made a compelling argument about why people were so obsessed with hunting—they did it for status.
Good hunters were revered for their abilities to provide food and hunting trips could serve political and social functions. But big game hunting was eventually done at the expense of the rest of the population: archaeologists still discuss whether the bow and arrow, probably introduced to California by groups coming out of Oregon, was such an effective hunting tool that the hunters wiped-out most of the big game, or whether the devastating effects of the Medieval Climatic Anomaly, which caused major droughts throughout the Great Basin and desert areas, pushed these people over the edge. But it is clear that serious changes took place, and big game hunting became unsustainable. By the time the next group of folks came along, the big-game hunters were on the verge of collapse.
This is one of the reasons why archaeology is important—we can look at past cultures and see how we, as a species, have dealt with big problems.
This research makes me uneasy because archaeology has shown repeatedly that cultures not in balance with nature die out. For millennia, people have sat around campfires debating whether to make the changes necessary to adapt to a shifting climate or depleted resource base, and invariably they said no. As a result, the graveyards of history are full of the corpses of cultures that failed to change when they needed to.
Now it’s our turn. History shows that nature won’t hesitate to take us out. We’re lucky in that we have probably one of the most adaptive cultures in history: we’ve made major changes—abolition of slavery, passing of environmental legislation, the Equal Rights Amendment—when we thought it was in our collective best interest. Even still, these landmark changes required decades of hard work and dedication to educate the broader population. We have our work cut out for us. We can either rise to the occasion, and make the investments necessary to stem climate change, or we can take our place with the rest of the dead in the graveyard.
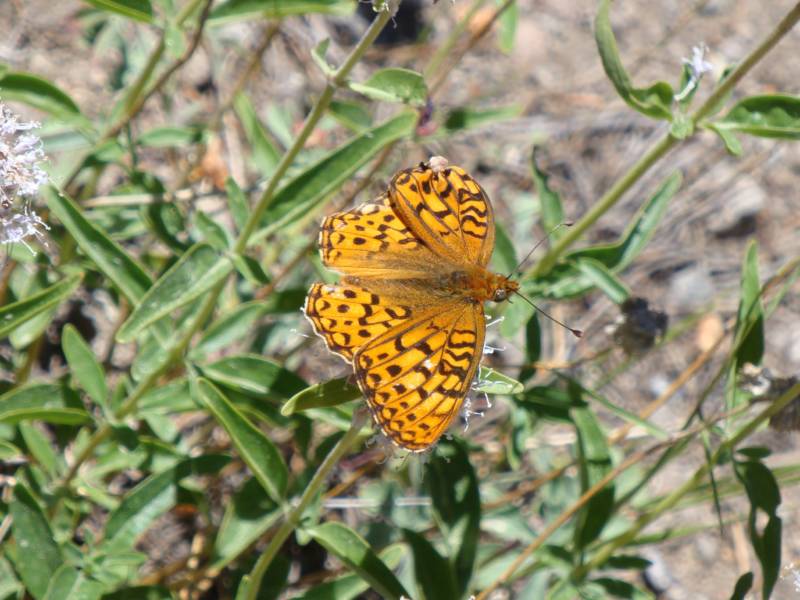
Atlantis Fritillary butterfly at Sierraville, CA Photo: Jennifer Wolf
California’s butterfly populations are suffering from the combination of a warming climate and increased land development, according to a new analysis from scientists at UC Davis.
The study, scheduled to be published online this week in the journal Proceedings of the National Academy of Sciences, draws from butterfly expert Arthur Shapiro’s database of more than three decades of observations of 159 species from 10 sites in the Sierra Nevada at varying elevations, from sea level to tree line.
The data shows that over the last three decades butterfly species diversity declined at half of the sites, with the most severe reductions occurring at the lowest elevations, where habitat destruction is greatest. The sites in the middle range showed evidence of habitats shifting upslope, as lower elevation butterflies began appearing at higher elevations. The only site studied where butterfly biodiversity and abundance has increased is at the highest elevation site, at 2,400-2,775 meters.
“These patterns are quite consistent with other studies on a variety of organisms,” said Shapiro. “The trend is for organisms to seek the climate to which they are adapted. So if it’s getting warmer, that means you go north, or you go up.”
While the population shifts appear consistent with warming temperatures (Both average maximum temperatures and average daily minimum temperatures increased across the majority of the sites), the study finds that warming alone is not enough to account for the loss of biodiversity at low and middle elevations. Researchers analyzed county land use data at the sites, and found that it correlates with the butterfly population data. The authors propose that habitat destruction due to urban and suburban development is most likely the leading cause of butterfly population deterioration at the lower elevation sites.
Citing pressures from human development as the main cause for species loss, the United Nations declared 2010 to be the International Year of Biodiversity. At the Johannesburg summit of 2002, governments agreed to achieve “significant reduction” in the rate of biological diversity loss by 2010, but according to the BBC, conservation organizations are acknowledging that this target is not going to be met, and that, in fact, the problem may be worsening.

 By Cody Sheehy