All posts by Molly Samuel

Molly Samuel joined KQED as an intern in 2007, and since then has worked here as a reporter, producer, director and blogger. Before becoming KQED Science’s Multimedia Producer, she was a producer for Climate Watch. Molly has also reported for NPR, KALW and High Country News, and has produced audio stories for The Encyclopedia of Life and the Oakland Museum of California. She was a fellow with the Middlebury Fellowships in Environmental Journalism and a journalist-in-residence at the National Evolutionary Synthesis Center. Molly has a degree in Ancient Greek from Oberlin College and is a co-founder of the record label True Panther Sounds.

Heat and Harvest: Calif. Farms on a Climate Collision Course

The Midwestern corn belt isn’t the only place threatened by climate change

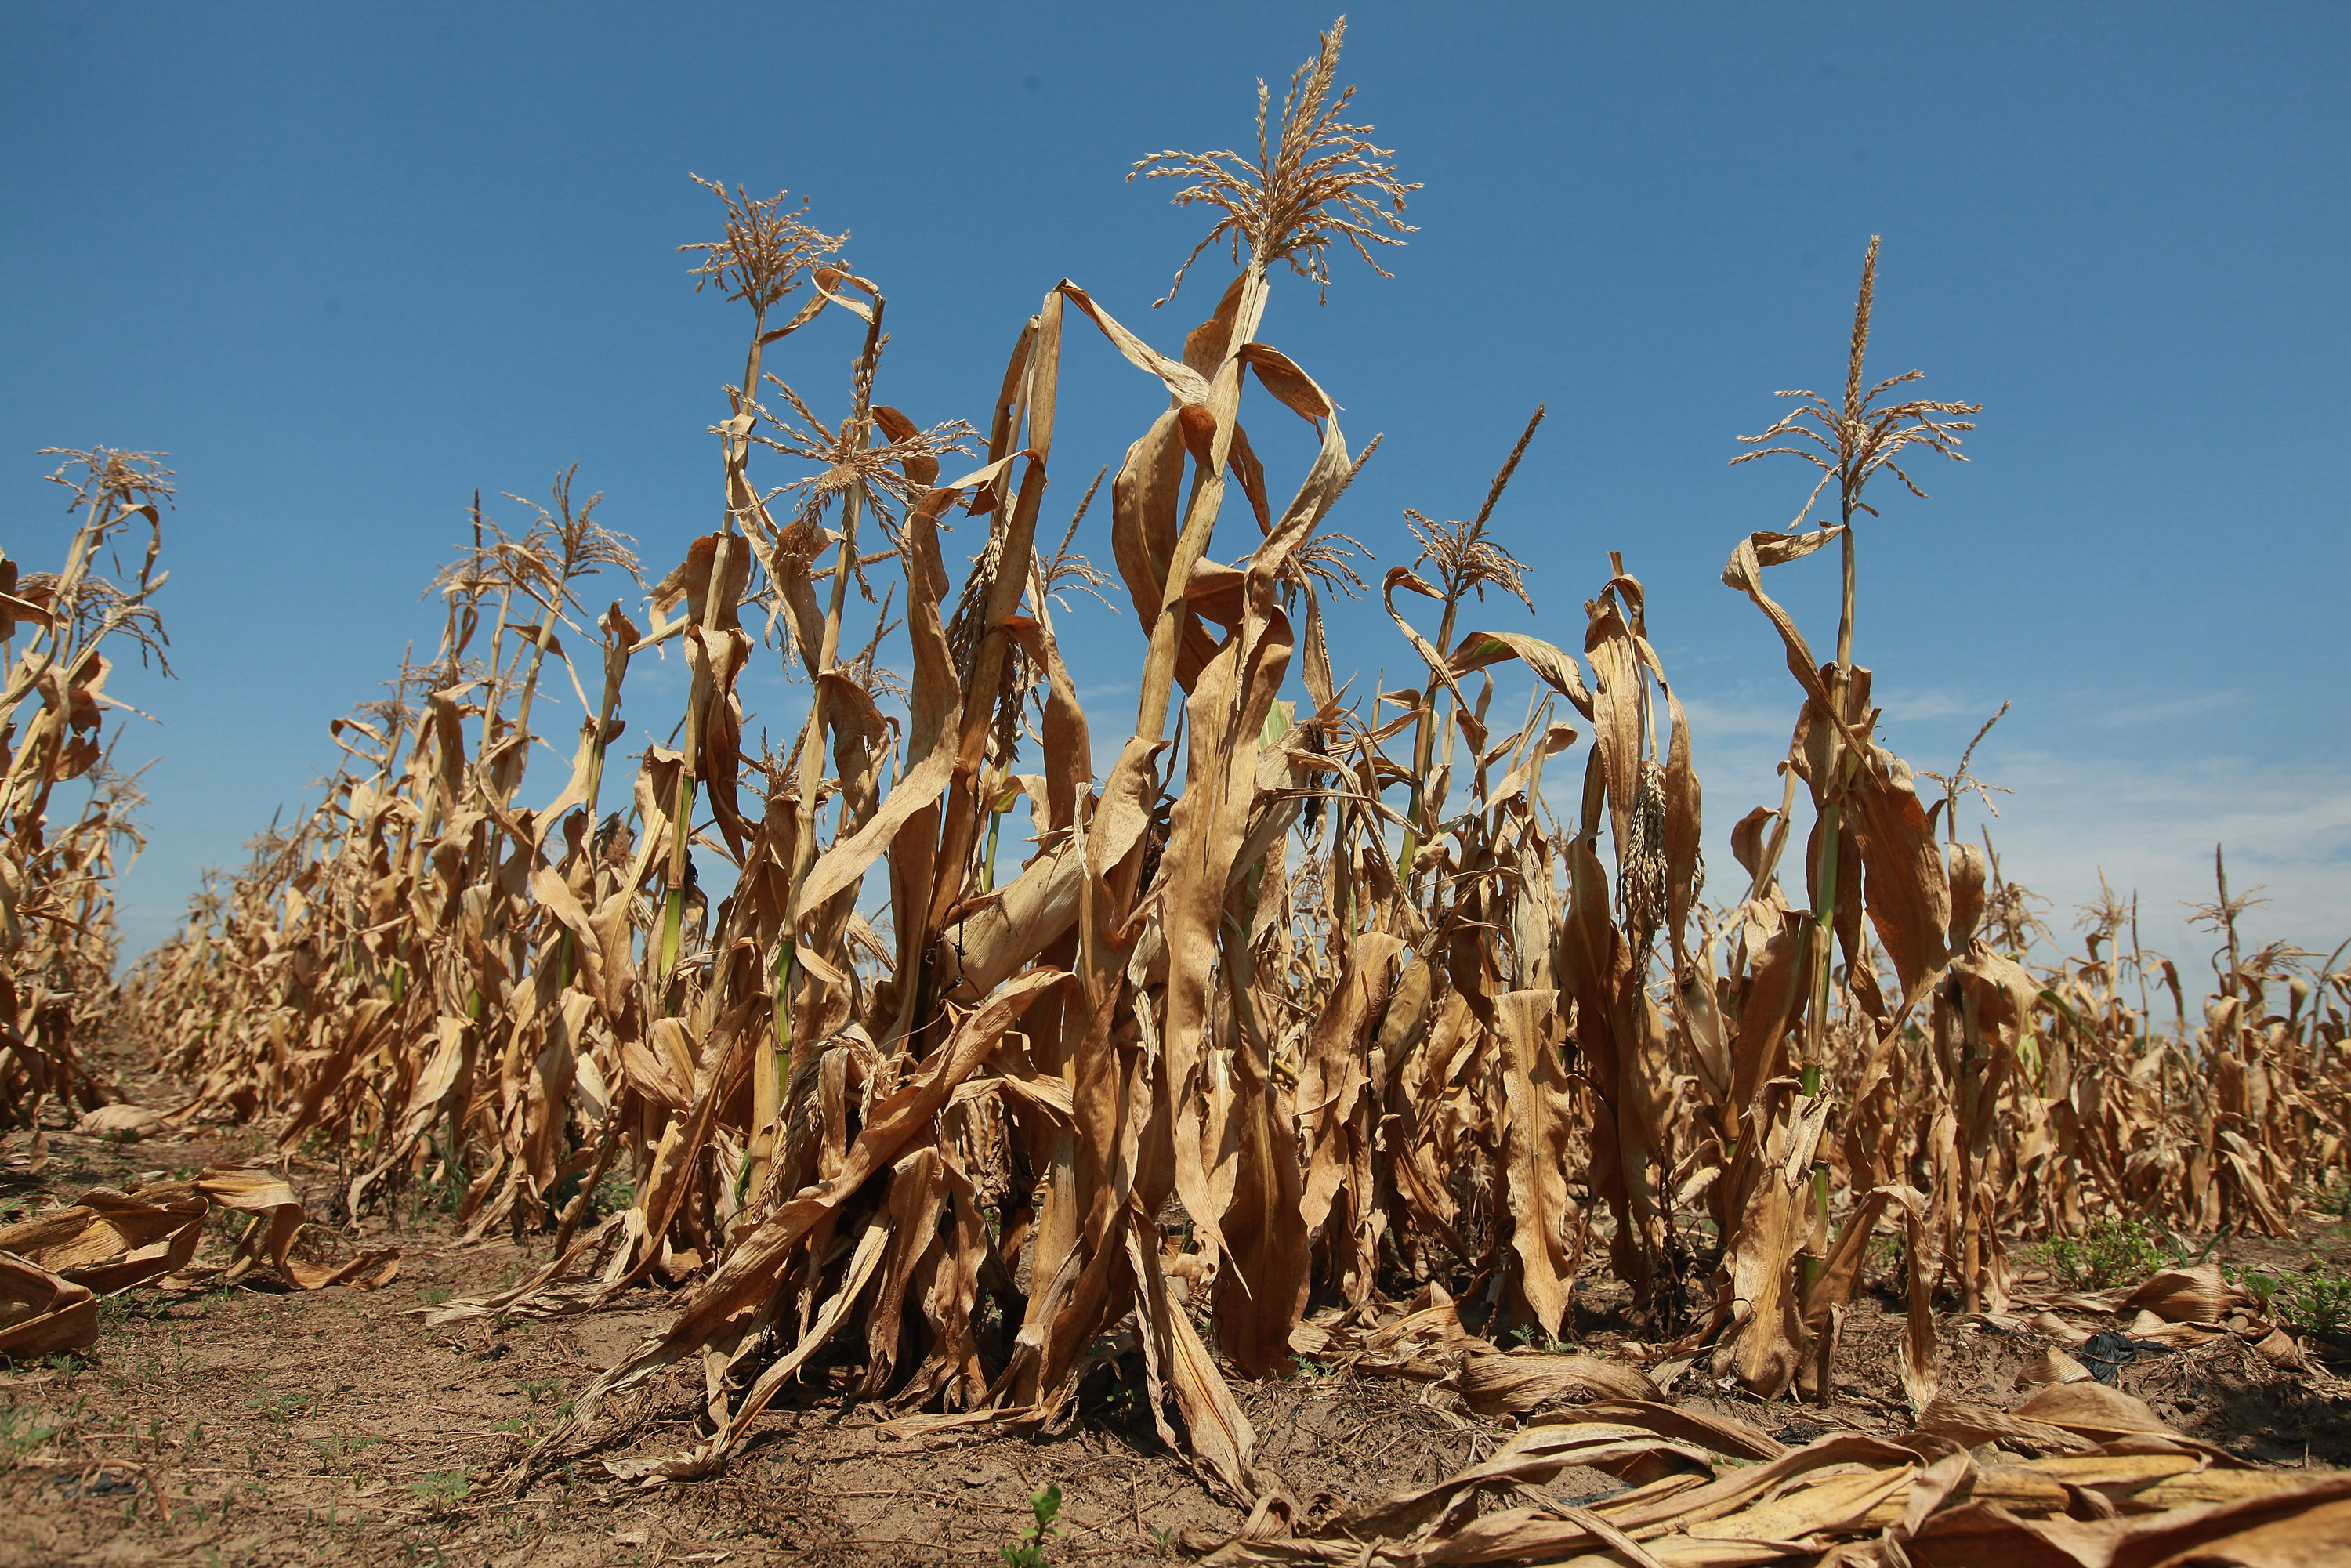
New pests, a shrinking water supply and rising temperatures will alter agriculture in California.
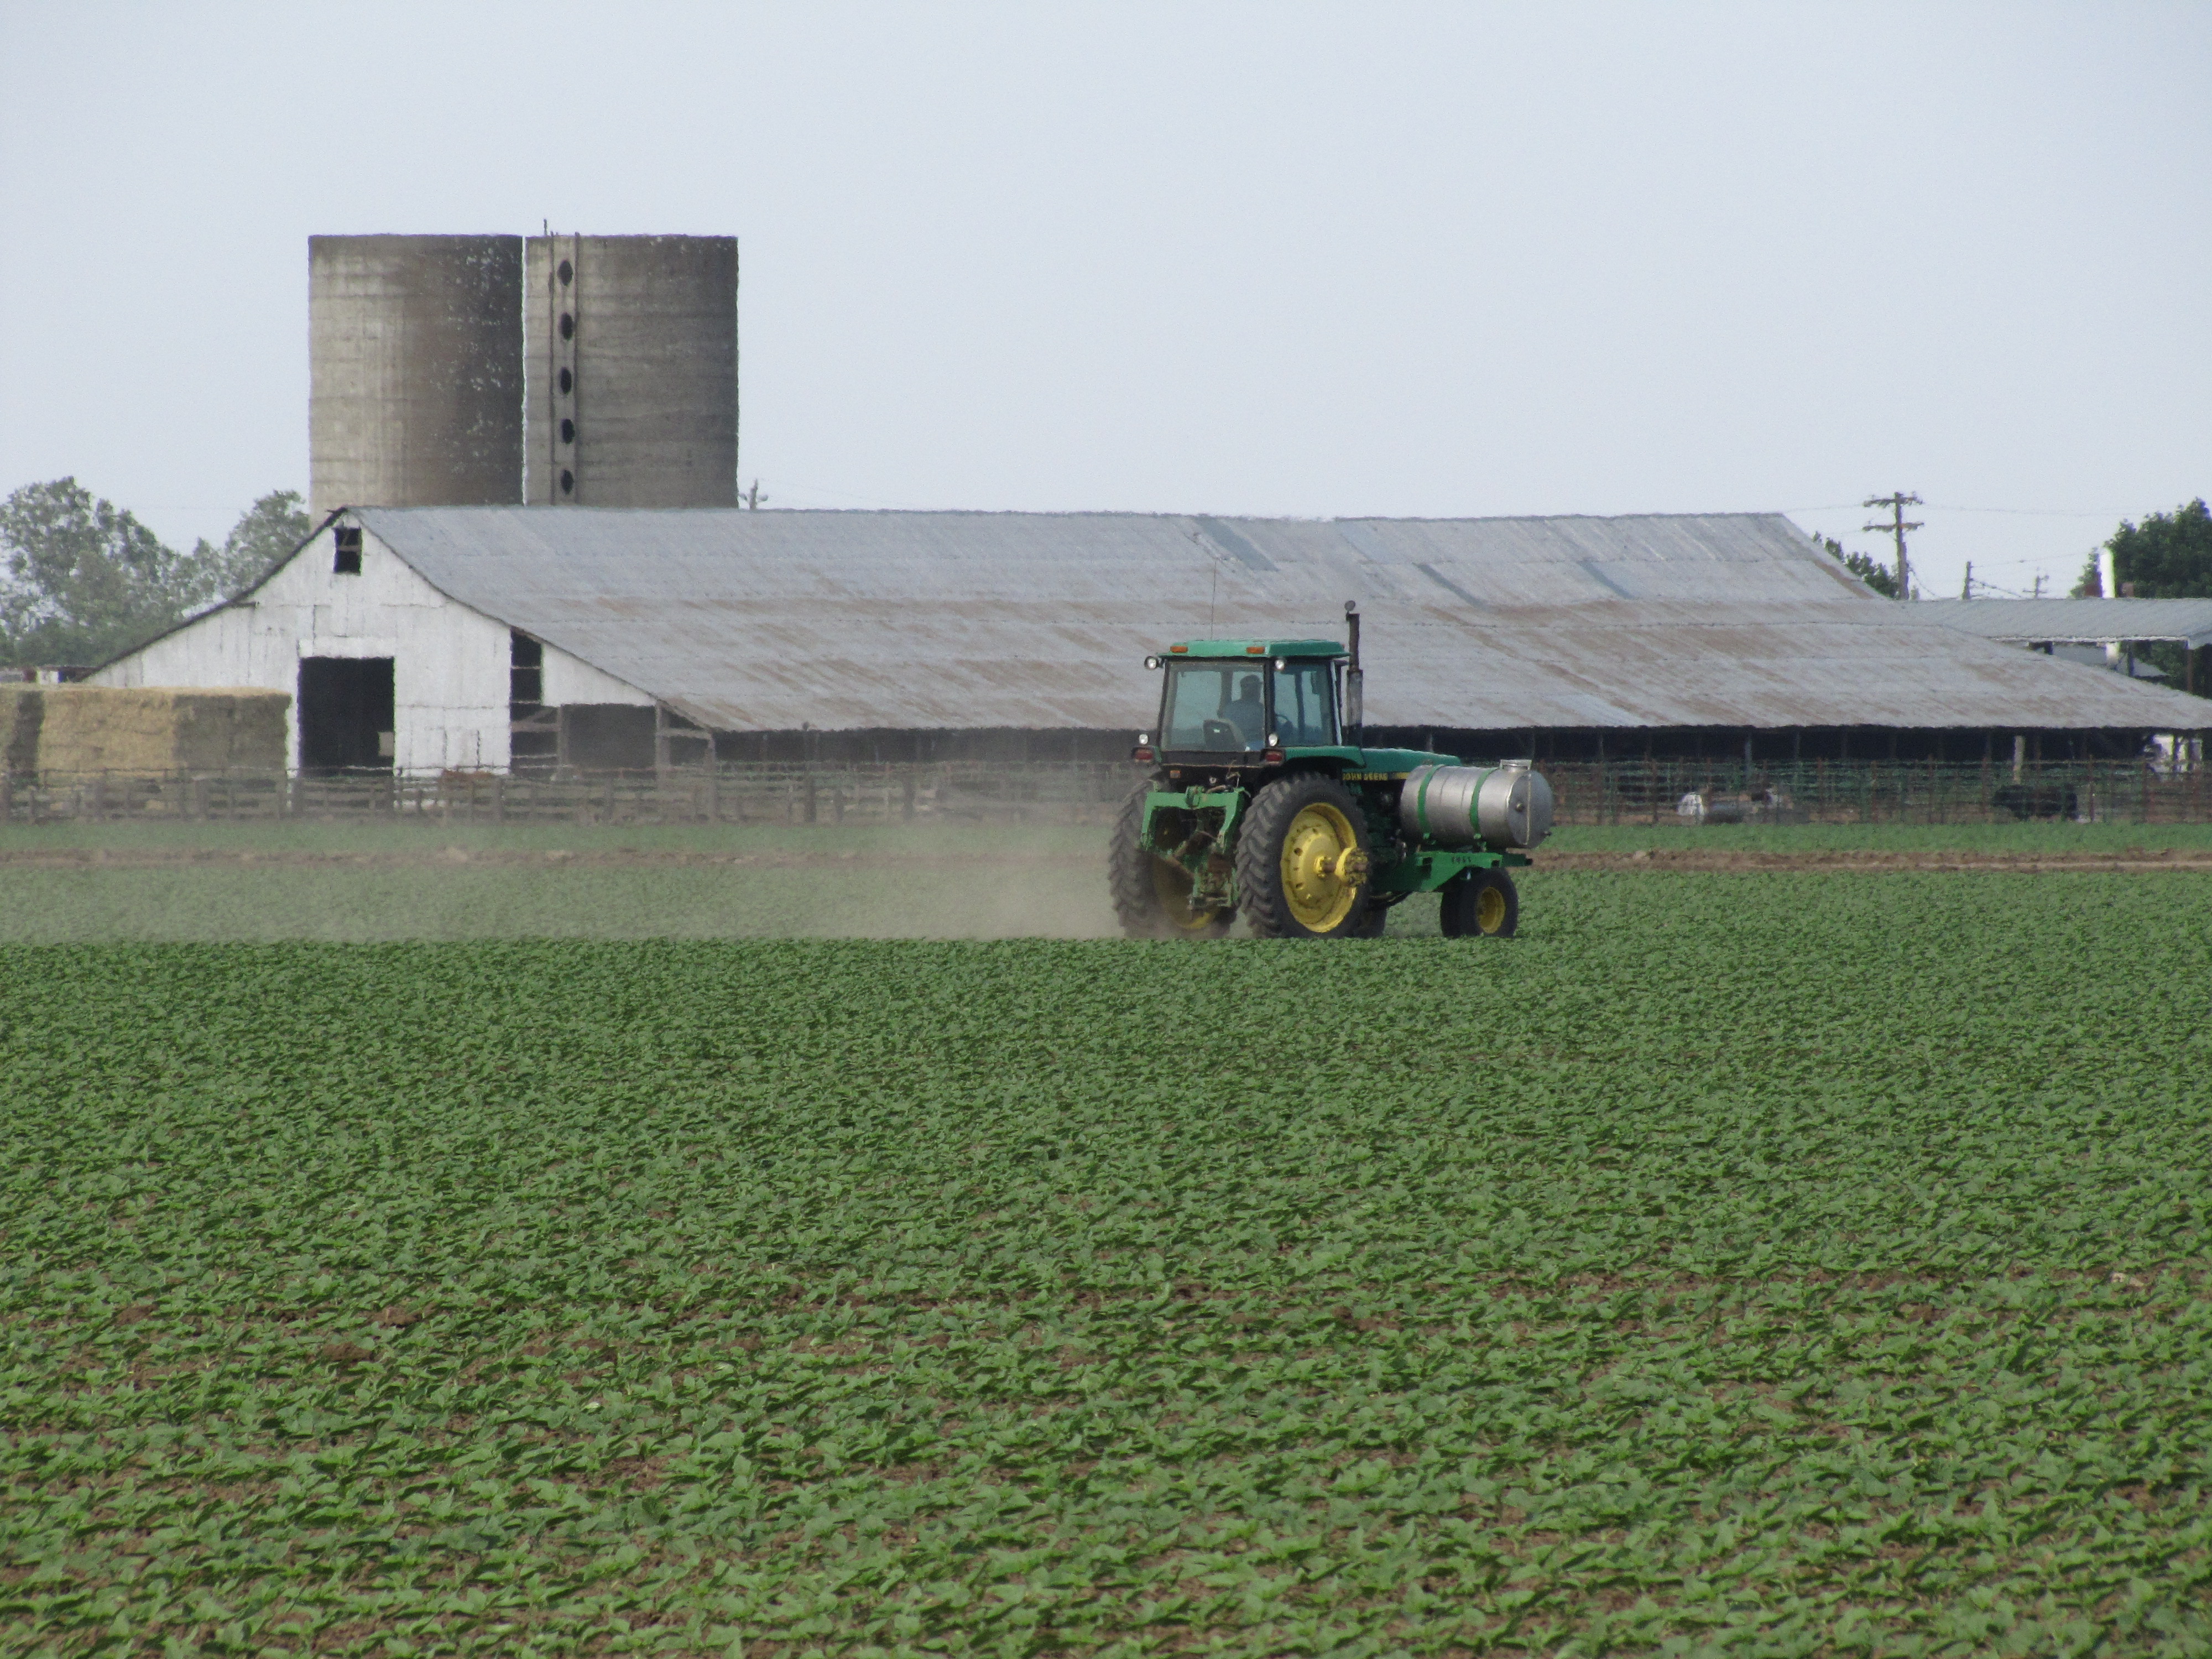
Tightening water supplies, encroaching pests and dwindling winter "chill hours," vital to many crops, are just some of the climate challenges facing California farmers.

Heat and Harvest, a new series from KQED Science and the Center for Investigative Reporting looks at the multiple climate challenges confronting California farmers. It’s no trivial matter. California’s Central Valley is widely known as “the nation’s salad bowl,” and there’s more than bragging rights at stake. Ag contributes more than $30 billion a year to the state’s economy.

Previously, Climate Watch has focused on efforts in the ag sector to conserve water or lower the carbon footprint. Some farmers are trying new technologies, others are experimenting with renewable energy. But meeting climate challenges on multiple fronts will, for some farmers and ranchers, be a matter of survival.

Here are links to some previous reporting from Climate Watch, from ag’s potential role in California’s emerging cap-and-trade program for carbon emissions, to innovation on the renewable energy front and new conflicts over land use. Continue reading Heat and Harvest: Calif. Farms on a Climate Collision Course
West Nile Virus and the Future of Once-Tropical Diseases

Midwest outbreak is the worst in U.S. history — and may be a sign of things to come

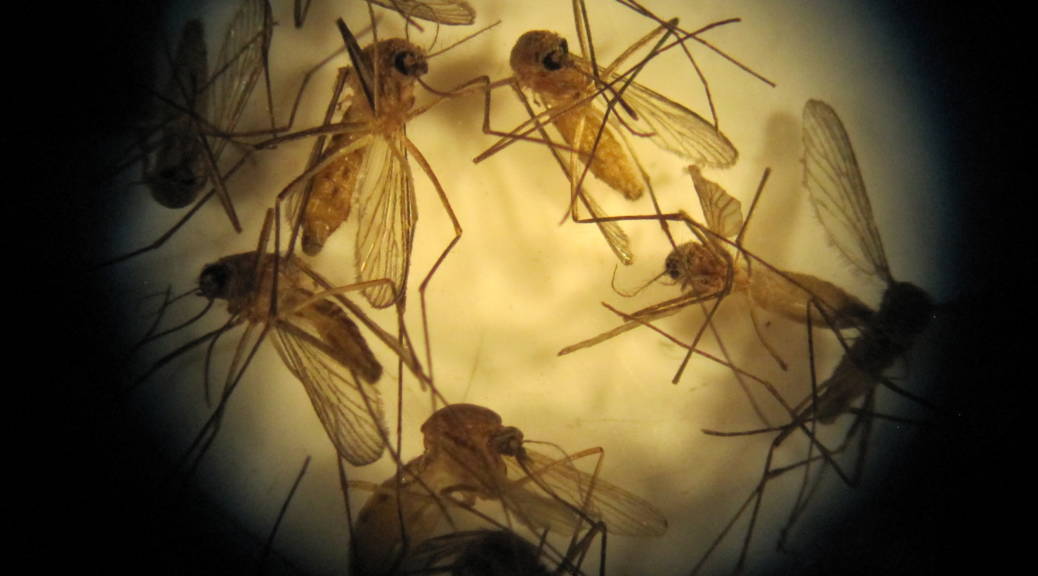
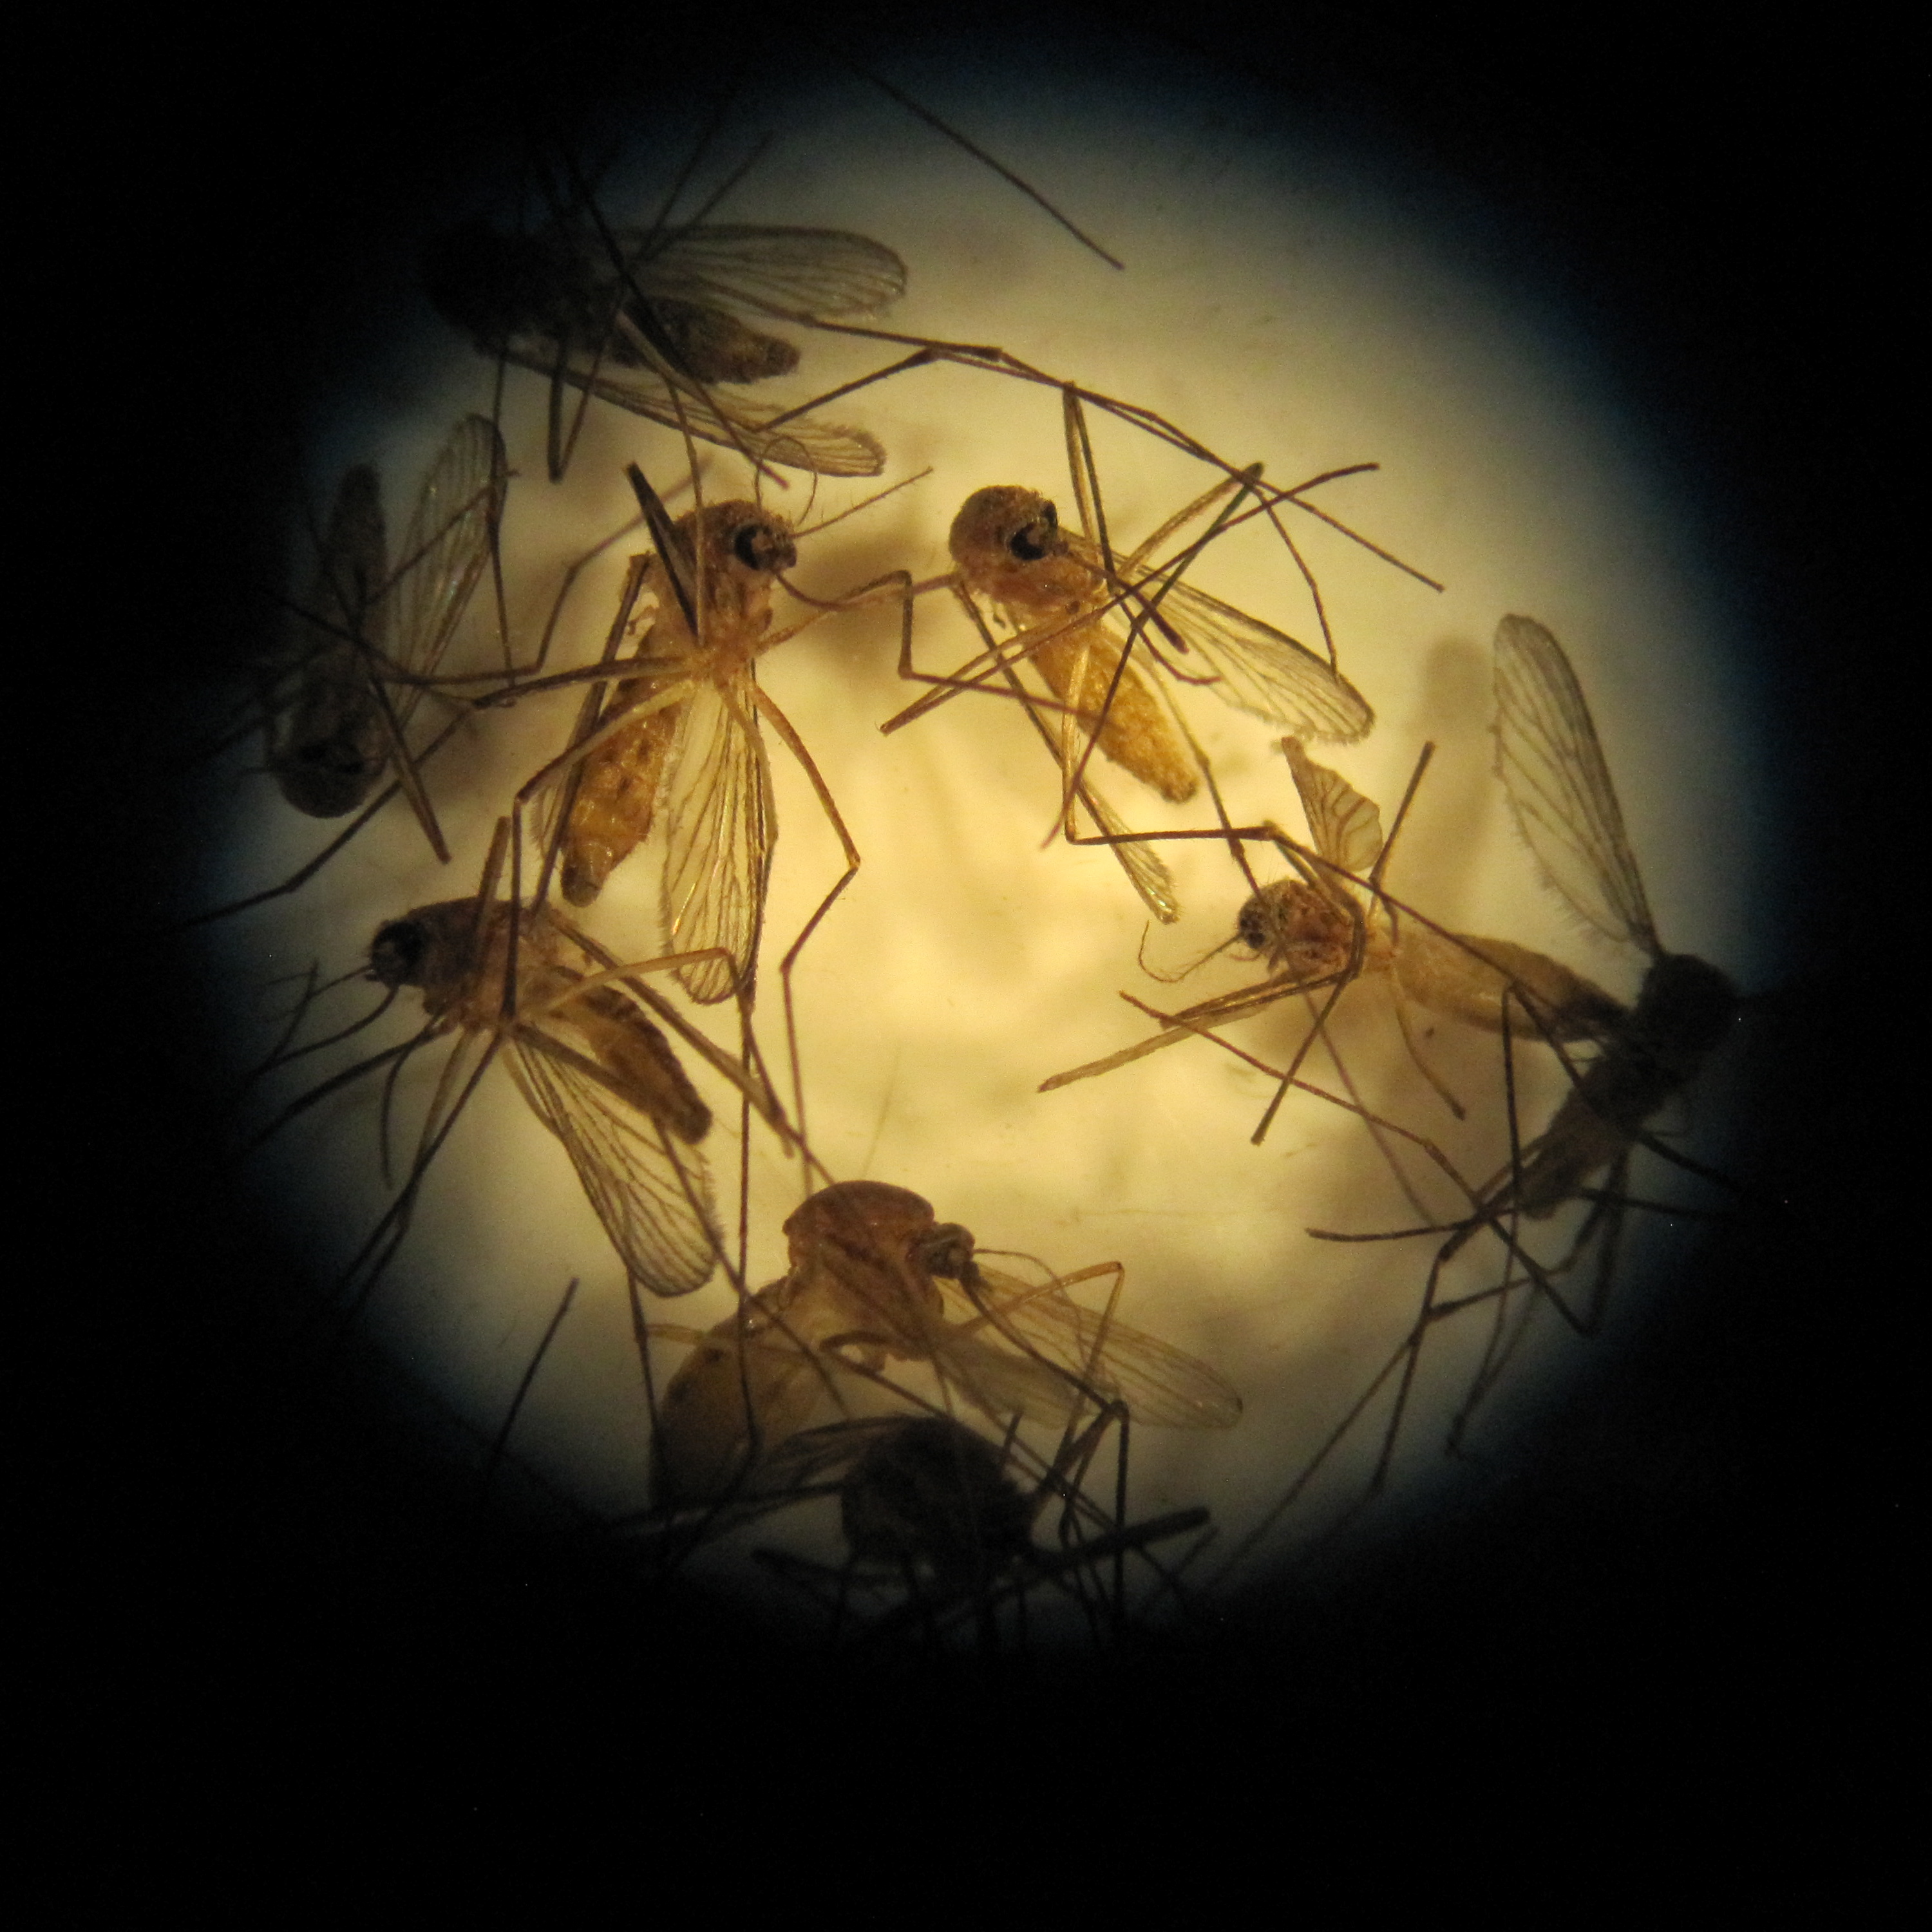
Mosquitoes under a microscope at the Sacramento-Yolo Mosquito and Vector Control District.

William Reisen began studying tropical diseases when he was drafted in the Vietnam War. He’d studied insects in school, so he worked as an entomologist for the Air Force. Eventually, his career led him to California, where he now heads UC Davis’s Center for Vectorborne Diseases. But even with his professional experience with mosquito-borne diseases, he says he never expected to see West Nile virus in the United States.

“Everybody was surprised,” he says. “If you were a betting person, and you wanted to guess the next virus that would cause trouble from abroad in North America, I think few of us would have expected West Nile.”

West Nile, a disease carried by birds and spread by mosquitoes, first made inroads in the U.S. in 1999, in New York. By 2003, it had reached California. In 2004 and 2005, there were hundreds of human cases; in those two years combined, 48 people in California died. Continue reading West Nile Virus and the Future of Once-Tropical Diseases

California Examines the Health Effects of Extreme Heat

A new report looks at how to prepare for — and adapt to — a warmer world

State agencies are bracing for the public health threat from extreme heat. Heatwaves can have devastating effects on public health; in a 2006 heatwave in California, hundreds of people died [PDF]. And scientists predict in the future, heat waves will be longer, hotter and more frequent.

In the future, heat waves will be longer, hotter and more frequent.

To try to keep the health costs to a minimum, the California Climate Action Team, led by the California Environmental Protection Agency and the Department of Public Health, is developing a plan to prepare for extreme heat[PDF].

The state’s plan addresses building codes and urban planning, state and local emergency response plans, health care system preparedness and worker safety. The recommendations include making sure the most vulnerable people can be protected from high temperatures, protecting key parts of the power grid from air-conditioner overload and planting more trees in cities. Continue reading California Examines the Health Effects of Extreme Heat

Why Wildfires Are Burning Bigger and Hotter

A century of fire suppression means there are more trees to burn, and they burn more dramatically

This has been a devastating wildfire season. Nationwide, more acres have burned this summer than at this time in any other year on record. In May and June, New Mexico weathered the largest fire in its history. Hundreds of homes and tens of thousands of acres have burned in Colorado. As the summer wears on, fire season has moved west — as it tends to do — and now the Ponderosa Fire is raging near Redding.

Has it always been like this? A new NPR series by Christopher Joyce explores what a century of fire suppression has meant for forests in the Southwest.


Continue reading Why Wildfires Are Burning Bigger and Hotter

Shifting Sands: San Francisco Begins Huge Erosion-Control Project

Ocean Beach has too much sand on one end, too little on the other

Trucks are moving sand from the north end of Ocean Beach to the south end.

Portions of San Francisco’s historic Great Highway are closed for a massive sand-moving project, part of an effort to slow erosion along the stretch of Pacific coastline known as Ocean Beach. By the end of the project, trucks will have moved about 100,000 cubic yards of sand.

“It’s the equivalent of 31 Olympic-sized swimming pools,” said Tyrone Jue, spokesman for the San Francisco Public Utilities Commission. “It’s a lot of sand that we’re having to move in a short period of time and that’s why we’re closing down the lanes of the Great Highway to accommodate the truck traffic.” Continue reading Shifting Sands: San Francisco Begins Huge Erosion-Control Project

Renters in California May Gain Access to More Renewable Energy

Proposed legislation would make renewable energy available to millions more Californians

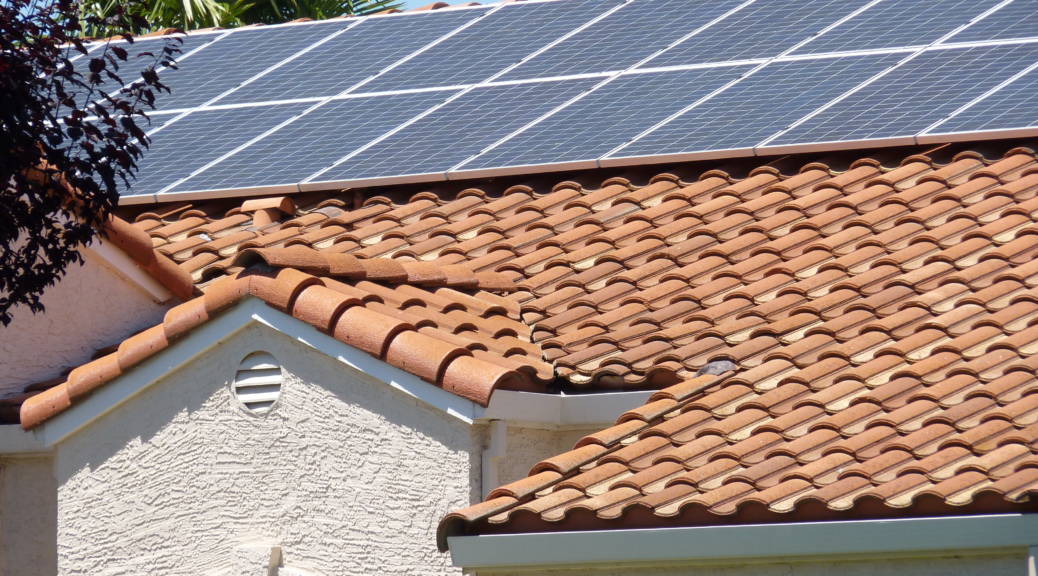
Most Californians can't install rooftop solar panels.

California’s big utilities are working toward the goal of generating 33% of their energy from renewable sources by 2020, but some people want more renewable power, sooner. And there’s a solution to that: generate your own. But for most Californians — those who rent, who live in condos, whose property isn’t suitable for solar or wind installations or who just can’t afford it — that solution isn’t really an option.

Senator Lois Wolk, from Davis, has written legislation with a new solution. If Senate Bill 843 passes, customers of one of California’s big three investor-owned utilities, Pacific Gas and Electric, Southern California Edison or San Diego Gas and Electric, would be allowed to purchase renewable energy directly from small, independent producers. Those producers send energy into the grid, then customers get credits on their regular utility bills. Continue reading Renters in California May Gain Access to More Renewable Energy

Heat Wave: California Takes its Turn

Forecast for inland temperatures to stay in the triple-digits this week

High temperatures in the Central Valley are expected to last through the end of the week.

America’s heat wave has caught up with California — at least the inland areas.

Sacramento has had six consecutive days above 100 degrees; an excessive heat warning is in effect from Merced to Bakersfield; and on Saturday Modesto tied its record for highest temperature for the date, at 105 degrees.

“In general, we’re about ten-to-fifteen degrees above normal for this time of year,” Holly Osborne, a meteorologist with the National Weather Service in Sacramento told me. “Today will be our sixth day of 100 or above in Sacramento, and we’re looking at temperatures being 100 or above for the rest of the week.” Osborne expects things to cool off, “moving into the weekend.” Continue reading Heat Wave: California Takes its Turn

New Tool Maps California’s Biggest Greenhouse Gas Emitters

Interactive map pinpoints the polluters next door

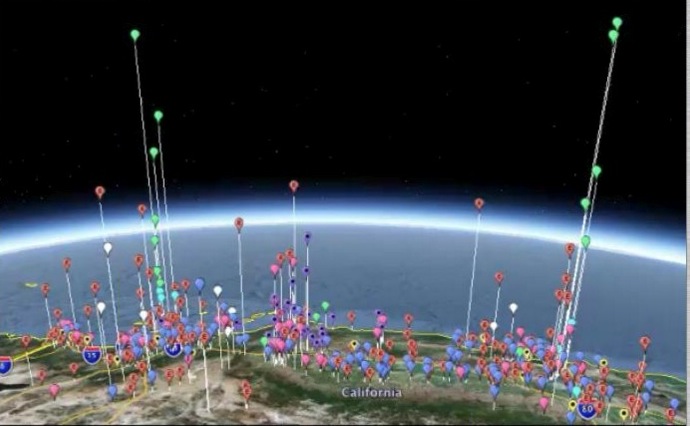
In this Google Earth view, the height of the "balloon" location markers indicates the volume of greenhouse gas emissions.

Wondering where all the petroleum refineries are located in California? Curious about which industries in your area emit the most greenhouse gases? Or which counties have the most big industrial polluters, and which don’t have any at all?

A new interactive map from the California Air Resources Board taps the versatility of Google Earth software to transform eye-glazing spreadsheet data into a visual, if wonky, feast.

The map shows the locations and greenhouse gas emissions of about 625 facilities — the largest industrial greenhouse gas emitters in the state. The graphical tool can filter by type of facility (cement plant, refinery, electricity generation), by county or air district. You can use the satellite view to see a facility’s physical footprint, then switch over to Google Earth to see how its carbon footprint stacks up against other emitters. The EPA released a similar map earlier this year, but without all the Google Earth bells and whistles. Continue reading New Tool Maps California’s Biggest Greenhouse Gas Emitters

Rising Seas Threaten California’s Coastal Past

Higher tides and increased erosion will wipe out archaeological sites

Hear the radio version of this story from KQED’s The California Report.

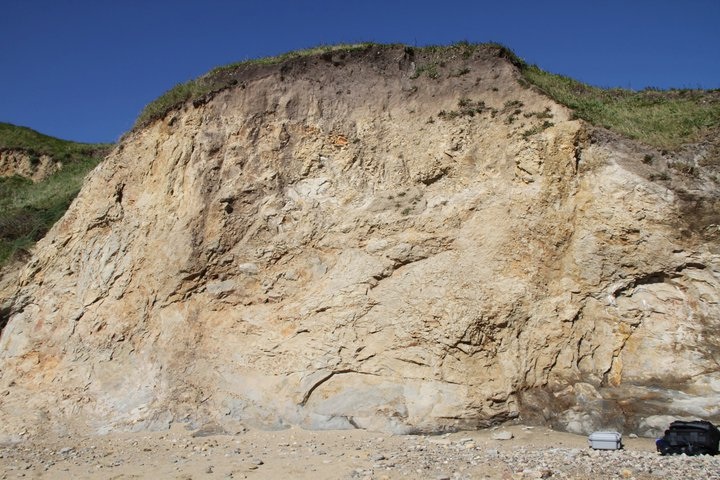
A site with evidence of more than 1,000 years of occupation is eroding due to high tides hitting the base of the cliff.

On a sunny day earlier this summer at Point Reyes National Seashore, I scrambled behind Mike Newland as he clambered across gullies and bushwhacked through thigh-high lupine. Once we got to the spot he was aiming for, on the edge of a sandy beach-side cliff, he stopped and started to pick through shells and stones.

“You can see, we’ve got sort of a handful of little guys here, popping out of the ground,” he noted. Some of these that we’re going to see, they weren’t here a year ago, when I came here last time.”

Newland, an archaeologist at Sonoma State University and the president of the Society for California Archaeology, was hunting for Native American artifacts, clues about what life was like in coastal California before Europeans arrived. It was easy for him to find them; wind, rain and tides have eroded these cliffs and exposed the ancient trash piles and stone tools.

This site and these cultural resources — some of them a thousand years old or more — might not be around for much longer. These pieces of California’s history are in danger of disappearing as the Pacific Ocean claws at the base of this cliff. Sea level rise is accelerating the problem. Continue reading Rising Seas Threaten California’s Coastal Past

Understanding the U.S. Drought and Heatwave: Five Good Visuals

As the drought drags on, these graphics and interactives explain what’s happening

1. “Drought’s Footprint”The New York Times

In June, more than half of the U.S. was experiencing moderate to extreme drought. How does that compare to other years? The Times’ graphic lays it out.

2. “Dried Out: Confronting the Texas Drought” — NPR, KUT and KUHF

The drought began in Texas in October of last year. Watch it grow over time, and explore a timeline that explains the root causes of the drought and how communities are responding.

3. “Flash Drought in U.S. Explained in 14 Seconds”Climate Central

Watch an animation showing the spread of the drought, from Texas and Georgia in March, to most of the Midwest and West by June.

4. Drought Impact Reporter — The National Drought Mitigation Center

This is “the nation’s first comprehensive database of drought impacts.” Submit reports of how the drought affects you, and search for drought impacts by state, whether they’re to agriculture, industry, public health or wildlife.

5. “Historic heat wave in hindsight: Hottest on record in Washington D.C., hotter than 1930”Washington Post

From the Post’s weather blog, a local, numbers-heavy analysis of the heatwave that hit Washington. With stats like “Longest period at or above 100: 7 hours on July 7 (tie with July 6, 2010 and July 21, 1930),” it’s like a Guinness Book of World Records for D.C.’s summer, and holds my usually California-focused attention.