All posts by Molly Samuel

Molly Samuel joined KQED as an intern in 2007, and since then has worked here as a reporter, producer, director and blogger. Before becoming KQED Science’s Multimedia Producer, she was a producer for Climate Watch. Molly has also reported for NPR, KALW and High Country News, and has produced audio stories for The Encyclopedia of Life and the Oakland Museum of California. She was a fellow with the Middlebury Fellowships in Environmental Journalism and a journalist-in-residence at the National Evolutionary Synthesis Center. Molly has a degree in Ancient Greek from Oberlin College and is a co-founder of the record label True Panther Sounds.

Paddling the Coast for Climate Clues

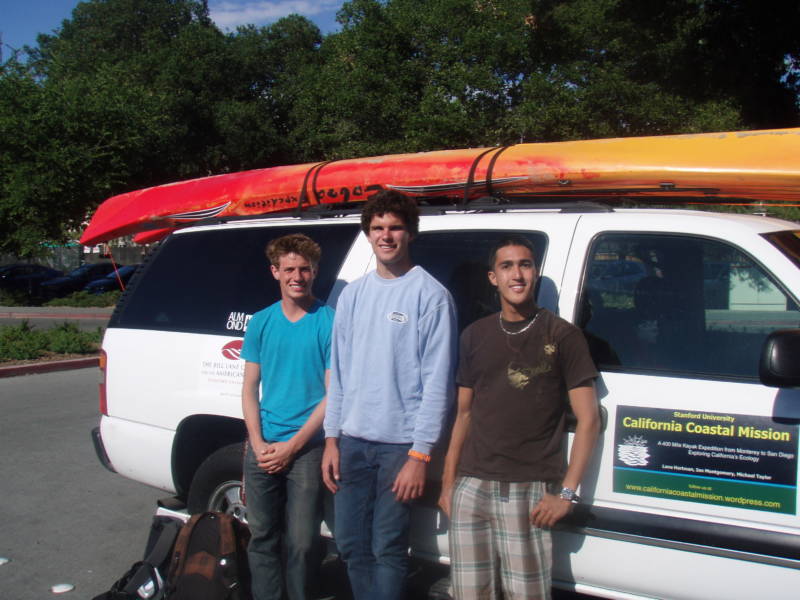
Lane Hartman, Ian Montgomery, and Michael Taylor. Photo courtesy of Ian Montgomery

Three Stanford students are starting a summer trip down the California coast today. They’ll be enjoying the views and the ocean breeze, but not from a convertible cruising down Highway 1. They’re kayaking from Monterey to San Diego. It’s going to take 2 months.

“If we walked we could go faster,” says Ian Montgomery, a sophomore Earth Systems major. He’s making the 400-mile trip with Lane Hartman and Michael Taylor. The three are united by, as they explain on their blog, a “love for surfing and great bodies of water” (Montgomery is from Southern California, Hartman and Taylor are from Michigan and the Marshall Islands, respectively).

Montgomery expects the slow pace (about 10 miles a day) and the sheer novelty of the expedition will provide opportunities to talk to locals about changes they’ve seen along the coast. The students will stop along the way to talk to ecologists, representatives from environmental groups, fishermen, and coast residents.
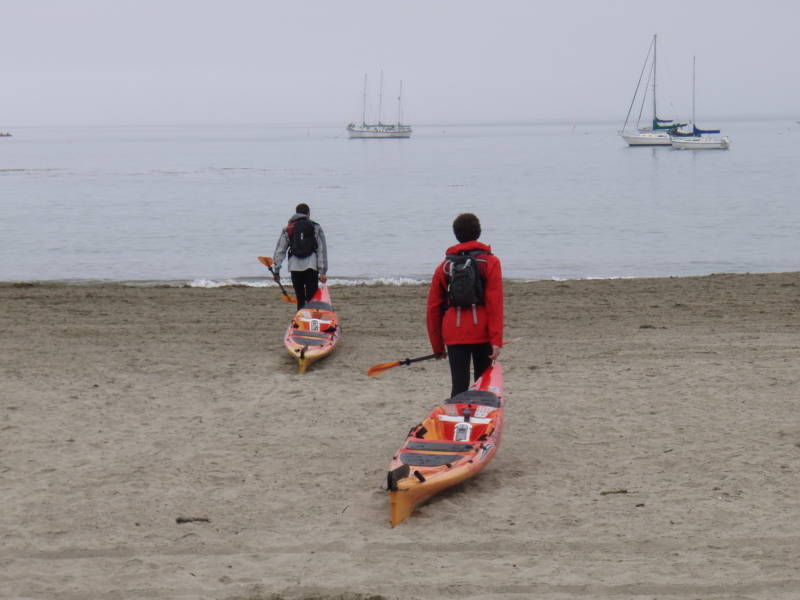
The students did a test run earlier this week. Photo: Lane Hartman.

The intertidal zone is an interesting place to study climate change, explains Montgomery, because there are so many variables: air temperature, water temperature, tidal action, and human impacts.

As the students travel they won’t just be collecting anecdotal evidence. They’ll take note of what animals they see in the water and also take pictures of the intertidal zone as they go along. By photographing a 25 centimeter by 25 centimeter square a day, they’ll create a series of snapshots of what lives where on the California coast.

They’ll be able to compare their findings with research from last century done by  marine biologist–and friend of John Steinbeck’s–Ed Ricketts. Montgomery unearthed Ricketts’s records of what species lived in the intertidal zone in Monterey in the ’20s and ’30s (some of the records are singed on the edges, survivors of a fire that tore through Ricketts’s lab in the 1930s). Montgomery suspects they’ll find that species have moved since then, pressed north by warmer temperatures. He already knows some have, like the tube snail (serpulorbis squamigerus), a species that was once limited to Southern California, but is now common in Monterey Bay.

You can follow their progress and see pictures from the trip on the students’ blog.
What’s an Albedo? (And Why You Should Care)

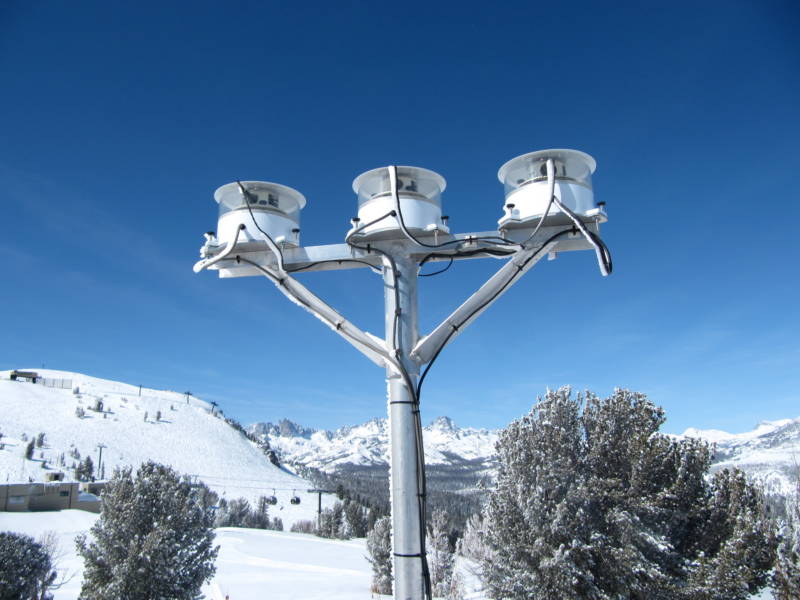
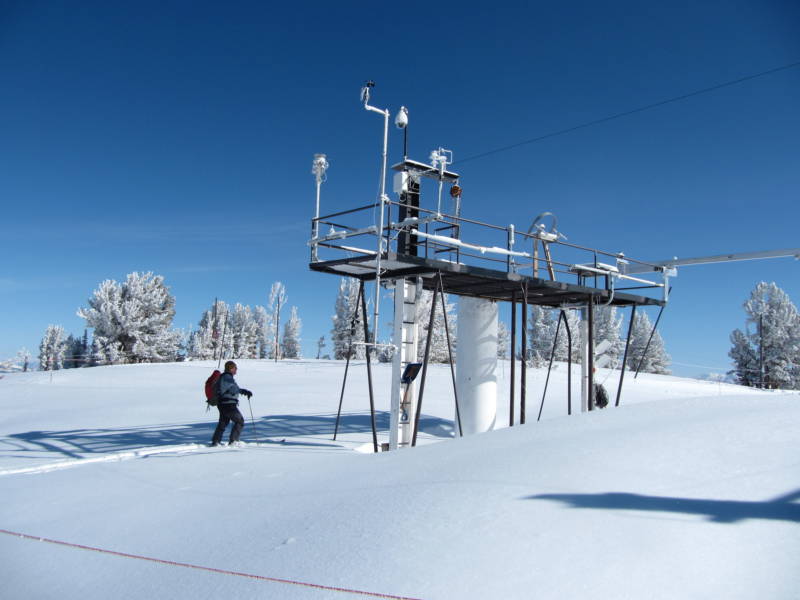
Jeff Dozier approaches the instrument tower on Mammoth Mountain.

When Jeff Dozier, a hydrologist at UC Santa Barbara, goes to work, he gets to enjoy quite a view. His snow lab is perched halfway up Mammoth Mountain in the central Sierra. We took a gondola to get up there; the other passengers were skiers and snowboarders itching to get out on the freshly fallen snow.

But the instrument platform from which we enjoyed views of the White Mountains is really only half the story. Dozier’s computer lab has much less of a view. In fact, it has no view. It’s buried under the snow, accessible only through what he calls a “Santa Claus entrance” (in the picture above, you can see the entrance–it’s the white tubular “chimney” extending down into the snow from the center of the platform).

The snow lab, operated by both UCSB and the U.S. Army Cold Regions Research and Engineering Laboratory (CRREL), uploads information about the snowpack to a website every fifteen minutes. You can see nearly real-time readings on, among other things, snow depth, temperature, humidity, and radiation.

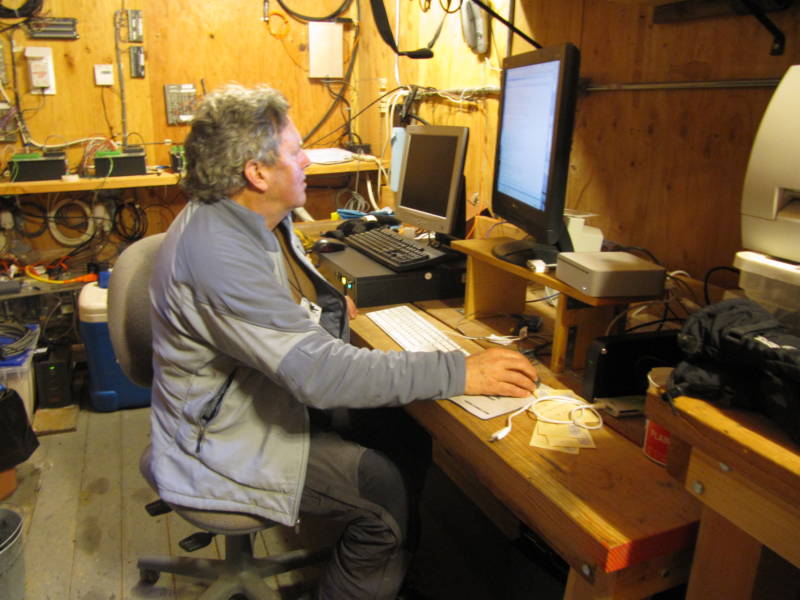
Dozier in the computer lab. Photo: Molly Samuel

Radiation is an important one. Instruments called radiometers are mounted on the tower. Some point up, measuring the radiation coming from the sun; others point down, measuring how much is reflected back to the sky by the snow.

Albedo” is the measurement of how reflective the snow is. Something completely white that reflects all of the sun’s energy has an albedo of one; something black, that absorbs all the energy, is zero. Bright, freshly fallen snow has a high albedo, typically above 0.8.

Even if the term is new to you, albedo is probably a familiar concept. As I reported for KQED’s The California Report this morning, Hans Moosmuller of the University of Nevada’s Desert Research Institute explains it in terms of outfits: on a sunny day, if you wear a black sweater you’ll be warmer than if wear a white one. You may notice it with roofs, too. I grew up in Atlanta, in a house with a black roof. Before my parents got an air conditioner, the upstairs bedrooms were unbearable in the summer. If we’d had a white

These radiometers measure radiation coming from the sun. Photo: Molly Samuel

roof, it would have been a little more bearable (though I can’t say it would have helped with Atlanta’s other charming summer attributes, humidity and mosquitoes).

The color sweater you wear has no bearing on the earth’s climate. Roof color could have an effect on a large enough scale. What really matters are the huge swaths of dark and light that cover the globe: ocean and snow.

When warming causes sea ice near the poles to melt faster, areas that had a high albedo (ice is very reflective) become  areas with a very low albedo (the blue ocean absorbs more radiation than forests or plain dirt). Moosmuller says it creates a feedback loop. The more dark spots there are, the more radiation is absorbed. So melting speeds up, and warming increases, exposing even more dark areas, and so on.

Pollution plays an important role that’s coming under increasing scrutiny. Deposits of soot or dust make the snow darker, so it melts faster, exposes more dark ground, and there’s that feedback loop again. In the Himalayas soot, also known as black carbon, from stoves, tailpipes, factories, and fires is having a measurable impact.

In the Rockies, there’s a similar problem caused by dust kicked up from ranches. Tom Painter of the University of Utah says the snow in the Colorado River Basin melts a full month earlier than normal. The difference the dust makes is so drastic, Painter says, that “We’re in an entirely new regime for snow melt…it would be like if we started measuring climate impacts fifty years from now.”

No one has yet done a long-term study on the effects of dust and soot on the Sierra Nevada snow pack. Moosmuller says he’s beginning to look into it now. In the summer, black carbon drifts into the mountains from California’s cities, ports, highways and farms in the Central Valley. Tony Van Curen, in a research project at UC Davis, has found that soot blows over from Asia, too.

There is good news in all of this: Black carbon, unlike most greenhouse gases, lingers in the atmosphere only for a couple of weeks. So reducing emissions could have a relatively quick impact.

(Some) Pika Persist at Low Elevations

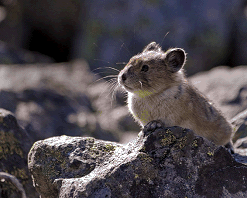
Photo courtesy of the Forest Service.
Photo: US Forest Service

American Pika are living at lower elevations and surviving warmer temperatures than previously thought, according to a paper in the journal Arctic, Antarctic, and Alpine Research (available for download at the US Forest Service Pacific Southwest Research Station’s site).

One of the authors, Connie Millar, said she saw pika far more often and in a broader elevation range than she had expected she would. Millar, a Forest Service ecologist, found all those pika using a method she developed to quickly determine if pika are living in places where one would expect to find them.

Pika, cute little rabbit relatives that live in high elevations throughout the West, have been in the news lately. The Center for Biological Diversity (CBD) petitioned for the pika to be listed under the federal Endangered Species Act in 2007, citing climate change as a threat to survival of the cold-adapted species. Last month, under a new administration, the U.S. Fish and Wildlife Service decided not to protect the pika, explaining that though some populations do seem to be in trouble, most are doing fine so far. (Climate Watch has followed the pika story; see previous posts here, here, and here).

This newest study would seem to support the federal decision. But Shaye Wolf, staff biologist with the CBD, says that though the study “provides a snapshot of where pika are now, long-term in-depth studies have found that pika populations are declining.”

The majority of those declining populations are in Nevada’s Great Basin, at relatively low elevations for pika colonies. One paper Wolf cites was recently published in Ecological Applications. Authors Erik Beever and Chris Ray concluded that shrinking pika populations in the Great Basin could be partially attributed to climate change. Pika have an extremely narrow band of temperature tolerance and can suffer heat stroke in temperatures comfortable to humans.

Wolf and Millar are both members of the California Pika Consortium, a newly formed research group. Millar plans to distribute her pika survey to colleagues in the consortium in order to continue gathering data on locations of pika colonies.

Meanwhile, even though the Fish and Wildlife Service has denied federal protection to the pika, CBD is still working on gaining state-level protection in California. CBD biologists consider the pika to be a bellwether species for climate change.

NASA’s Carbon Trackers Yield New Maps

Almost lost amid the Copenhagen media clutter was last week’s meeting of the American Geophysical Union in San Francisco. So this week we’re playing a little catch-up. Climate Watch contributor Molly Samuel has the last of three posts on some things that caught our attention at AGU.

The UN’s Collaborative Programme on Reducing Emissions from Deforestation and Forest Degradation in Developing Countries, or REDD, was a big topic the past two weeks at the climate conference in Copenhagen. Wealthy countries, including the United States, have put billions of dollars on the table to help developing countries use sustainable forestry practices.

Back here on the California climate beat, there’s forestry-related news, too. Scientists at the NASA Ames Research Center in Mountain View (see map, below) have been working with the California Energy Commission and the Air Resources Board to measure California’s greenhouse gas emissions for the state’s mandated greenhouse gas inventory under AB-32 (the Global Warming Solutions Act of 2006).

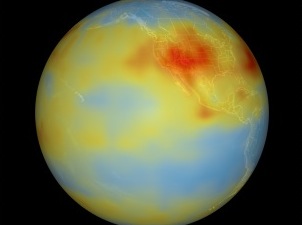
Carbon mapping by satellite. Image: NASA
Carbon-mapping California by satellite. Image: NASA

At the American Geophysical Union conference in San Francisco, NASA’s Christopher Potter shared information he’s gathered using MODIS, an imaging instrument that’s hitching a ride on NASA’s Terra satellite. Potter’s data shows that California’s ecosystems–forests, grasslands, croplands, wetlands, etc.–emit about the same amount of carbon that they absorb each year. And in wet years, they absorb considerably more. In an email Potter says, “the natural ecosystem sources can decrease or increase the net emissions of CO2 in the state by about 15%, depending on whether it is a normal precipitation year or a below-normal precipitation year, respectively.”

MODIS isn’t NASA’s only tool aimed at California as it circles the earth. AIRS, or Atmospheric Infrared Sounder, collects data from the troposphere (the layer of the atmosphere closest to the earth). NASA designed it to improve weather forecasting—the troposphere is where our weather happens–but it’s turned out to be an effective instrument for measuring carbons as they bubble up from the earth and circulate in the atmosphere.

Having collected seven years of data on carbon dioxide, carbon monoxide, and methane, scientists (and now you) can actually see where the carbons are coming from and where they go. NASA has posted animations showing the methane emitted by wildfires in California, and maps of carbon dioxide concentrations around the world.