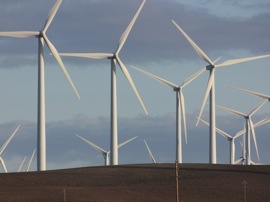
California Regulators say the state’s utilities about doubled the growth of new renewable energy sources last year. The California Public Utilities Commission says developers added 653 megawatts of capacity in 2010, nearly twice the pace of 2009.

For all that, utilities did not quite make the state-imposed requirement that they get 20% of their electrical generation from renewables by last year. That requirement was affirmed by the legislature. In September of last year, former Governor Arnold Schwarzenegger moved the goalposts to 33% by 2020. But that mandate is backed by an executive order, not by state law.
According to the CPUC quarterly report, last year’s progress puts the state’s total potential renewable power production over 1,700 megawatts. Almost half of the 2010 gains were achieved by a single big wind farm in Kern County coming online. In addition to wind and photovoltaic solar, some of the new generation last year came from biomass and small-scale hydro. The state does not recognize power from large hydroelectric dams as countable toward its renewable energy goals.
Major utilities will update numbers for their individual energy mix in March. At the end of 2008, Southern California Edison led big utilities in the green power derby with more than 17% renewables in its mix. PG&E provides more than 14% and San Diego Gas & Electric more than 10%.
The CPUC says there are already enough megawatts “under contract” to meet that 33% goal in 2020 — but glitches in financing, siting and permitting could all get in the way of some of that power actually being delivered. The total share of electricity provided by renewables such as wind and solar energy moved to more than 15% in 2009, from about 13% in 2008.
None of the renewable energy gains last year were from large solar-thermal projects, though several of those were permitted and broke ground toward year-end, as developers raced against a deadline to get federal stimulus funding.
5 thoughts on “CA Doubled Pace of Renewables Last Year”
Comments are closed.

Here’s something I’ve always wondered, but never see addressed. Unlike fossil fuels or nuclear power, most sources of renewable energy are variable (the wind blows harder or softer, some days are cloudy, etc). When we read about a wind farm that produces X megawatts of power, is that peak, average, or some other number? If they’re using peak figures, then the 20% requirement becomes a crock.
To answer your question, when it says 1700MW, it is referring to average capacity over one year…taking into account average annual windy and sunny days, etc.
Thanks Scott!
Scott: What is the source of your information that capacity “is the average capacity over one year”. I think this is not correct. When the CPUC says “developers added 653 MW of capacity” I believe that what they mean is the rated 100% ouput of the new plants. The actual yearly average of solar or wind projects are much less, approx 22% for wind. I don’t have a figure for solar.
I have tried to find on the CPUC site, the amount of renewable power produced yearly for past years. I can’t find it. I think that’s because it’s embrassingly low and the growth has been embrassingly low.
From memeory, I beieve the amount of renewable energy actually produced was 7% when the effort for a 20% target in 2010 was begun and is now ~15%. The growth rate in actual production is only 1 to 2% per year.
How is it possible to ramp up to 33% in 2020?
If someone has accurate statistics on this, I’d like to see them. CPUC doesn’t make them public.
I’d like to provide a little clarification — the answer is that when someone quotes that a wind project generates xxMW, they are referencing nameplace capacity, which is the maximum output of the project when the wind is blowing. For example, my company has a 150MW wind project in Solano County – the total net capacity factor (the measure of efficiency) is somewhere between 33-43% (I need to be vague for confidentiality issues). When the wind is blowing the project produces 150MW but over the course of a year if you assume a NCF of 35% (the wind of course is not always blowing at speeds necessary for max production and fo course sometimes is not blowing at all), the amount of MWh produced is (150*.35*8760) — 150MW * NCF * hours in a year). Note that the same holds for a natural gas facility, a 500MW natural gas facility has a capacity factor of something like 85-90%.
Hope that helps,
Mark Tholke
Director, Southwest Region, enXco