Color-coding climate risks in the Golden State

Climate change will disproportionately affect California’s most disadvantaged and isolated communities, according to a recent report from the Pacific Institute.
By looking at a broad array of factors – from social indicators such as income and birth rates, to environmental ones such as tree cover and impervious surfaces – the Oakland-based think tank has found that 12.4 million Californians live in census tracts with high “social vulnerability” to climate change.
This vulnerability can play out in various ways, says Heather Cooley, co-director of the institute’s water program and a lead author of the report. “In low-income communities, many people may not have insurance,” Cooley told me. “So when a flood or fire hits their homes, they may not be able to rebuild. If they’re suffering from a heat-related illness, they may not be able to seek treatment and their health may deteriorate as a result.”
Other vulnerable populations such as students and the elderly, she pointed out, are less likely to have access to a car and are therefore more vulnerable in an event such as a wildfire or flood requiring immediate evacuation.
While the interplay between climate and demographics is complex, the report finds that many of the state’s poorest and most isolated communities – such as the unincorporated agricultural towns in the Central Valley – will be especially hard hit by rising temperatures. Another Pacific Institute study released this week found that climate change could increase California water demand by eight percent by 2100 — a scenario that will surely exacerbate problems for all California communities.
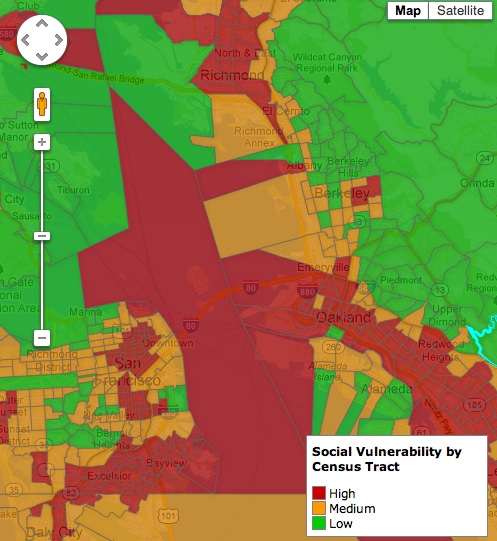
The vulnerability rankings can also be viewed in a color-coded map broken into individual census tracts. Green areas indicate zones of lowest hazard; yellow, medium; and red, high.

A glance at the Bay Area section of the map reveals familiar patterns. The region’s industrial cities and neighborhoods – Richmond, Vallejo, West Oakland, Bayview-Hunters Point, San Leandro, East Palo Alto, for example – are mottled with red, indicating high vulnerability to a shifting climate.
It’s well known that residents in these low-lying areas — many of them poor people of color — live today amid heavy industrial emissions. In the years ahead, however, they will be faced with disproportionate risk of flooding from rising sea levels, according to the report. Elevation and income are not always predictors of future flood risk, however. Cooley points to Los Angeles. There, she says, areas at greatest threat from sea level rise are in higher-income neighborhoods.
Other studies have used similar social vulnerability indices including the work of University of South Carolina professor Susan Cutter, but none have gotten it down to such fine detail, says Cooley.
“There’s been a lot of focus on how we’re going to be impacted by climate change,” she said. “This takes it to the next step and looks at who is going to be impacted by climate change. It helps us to better understand what policies need to be put in place and who we need to be thinking about.”
7 thoughts on “12 Million Californians ‘Highly Vulnerable’ to Climate Change — Now What?”
Comments are closed.


Yeah it was Right Information of vulnerable 12 Million Californian were affect for this changing the temperature.Thanks for this Information.
If you read the study criteria, almost all of them have nothing to do with climate change. The authors of this “study” just assumed the results. Here are some of the factors: low income, foreign born, people of color, etc. Low and behold, low income immigrant people of color are at risk! Amazing.
Hi Jackson, I’m a co-author of this study and thought I’d quickly respond to your comment. We spent a great deal of effort compiling data from many sources to create a composite indicator of a group’s vulnerability to climate change-related impacts like floods, wildfires, or heat waves. We used two criteria: (1) evidence from peer-reviewed studies, and (2) feedback from focus groups with community-based organizations that work in at-risk communities.
Here is just one real-world example of how a factor you cited affects a group’s vulnerability. In 2006, a year after Hurricane Katrina devastated New Orleans, only 43% of New Orleans’ black population had returned to the city; compared to 64% of whites*. This is only one anecdote, but there is a body of evidence that shows that race is, unfortunately, related to a group’s ability to respond to and recover from a disaster. There could be intrinsic factors involved (such as fewer people carrying flood insurance) or extrinsic factors such as bias by emergency responders and reconstruction agencies.
The approach we used is imperfect and there are certainly limitations to this type of geographic analysis, which we attempted to thoroughly list and describe. But we do think this type of information is useful and important to policymakers. Some day, there WILL be another natural disaster the size of Katrina. The question is: How prepared will we be, and how quickly will we recover? Further, what will we do to protect the most vulnerable among us: children, the poor, and the elderly?
*From a research study that “investigated return migration to the city by displaced residents over a period of approximately 14 months following the storm,” by a team of sociologists and demographers, and published in a peer-reviewed scholarly journal in 2010. Reference:
Fussell, E., N. Sastry, and M. VanLandingham. “Race, Socioeconomic Status, and Return Migration to New Orleans After Hurricane Katrina.” Population & Environment 31, no. 1 (2010): 20–42. http://www.ncbi.nlm.nih.gov/pmc/articles/PMC2862006/
Thank you for making this information available to our policy makers.
You as well I know that they will not touch it unless they figure out a way
which will produce funds to line their pockets with.
Why lefties always come up with these phony doomsday scenarios ?
Looking for an excuse to steal more money from the working stiffs ?
That is where it usually winds up. It is also a good diversion from the
real economic disaster they created.
We really needed to spend the money on this study which probably will
never be used since there are bigger problems to address like high speed
train to nowhere. At least these guys got paid. Amazing how our money is used.
Everyone has a photographic memory. Some don’t have film. Keep up the good work money and time well spent.