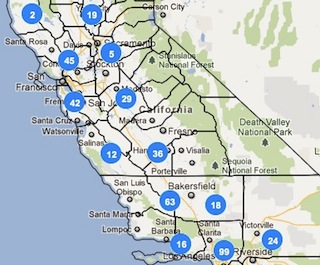
An interactive map with fresh data and more selective features

The federal Environmental Protection Agency has just made tracking greenhouse gases a lot easier. The agency has produced its own map of major GHG producers, with fresh data and customizable features.
Two years ago, when we produced our map of California emitters for Climate Watch, we had to cobble it together with raw data from the state Air Resources Board emissions inventory, numbers that were relatively hard to find and infrequently updated. The EPA’s new map allows you to select your state, zoom into specific regions and view emissions by type and volume.
One thing the original Climate Watch map still provides is a visual connection between California and large coal-fired power plants in neighboring states, from which California imports electricity. The EPA map provides visual evidence that greenhouse gases are still on the radar in Washington. In an appearance at EPA this weekto thank staffers for their perseverance, President Obama gave an eleven-minute speech, mentioning climate change only once, in the context of recently-announced fuel economy standards. Obama didn’t mention greenhouse gases as such, but referred to “pollution that contributes to climate change.”
