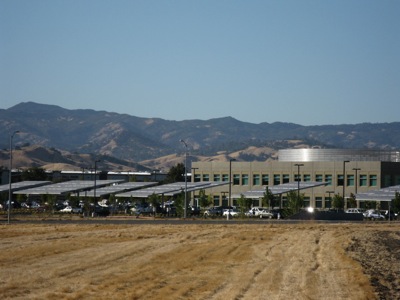
Solar Gain
In green building circles, the term “solar gain” refers to how much a place heats up during the day, from sun exposure. This week marked “gains” for both solar and wind energy development in California. For years, the buzz around solar power has centered on how rapidly the cost of photovoltaic systems would drop enough to make it truly competitive.

Lawrence Berkeley National Lab released its second annual “Tracking the Sun” report this week, which actually tracks the cost of harnessing the sun’s energy in the U.S. It finds that the last decade (1998 to 2008) has seen the cost of installed photovoltaic power drop by 30%, averaged nationwide, although there were some short-term quirks. Among the “key findings:”
Preliminary cost data indicates that the average cost of projects installed through the California Solar Initiative program during the first 8½ months of 2009 rose by $0.4/W (per watt) relative to 2008, while average costs in New Jersey declined by $0.2/W over the same period.
That’s an interesting quirk at a time of generally low inflation and would seem to resonate with our recent report from Rob Schmitz, comparing the “red tape” cost factors between California and Japan (sorry, we didn’t get to New Jersey). Of course in markets, as in climate science, short-term fluctuations aren’t necessarily meaningful.
While the authors surveyed data from 16 states, they note that the results are “heavily skewed towards systems in California and New Jersey, where the vast majority of PV systems in the U.S. have been installed.” So clearly, California is participating in the longer-term trend of declining costs.
Average installed costs vary widely across states; among ≤10 kW systems completed in 2008, average costs range from a low of $7.3/W in Arizona (followed by California, which had average installed costs of $8.2/W) to a high of $9.9/W in Pennsylvania and Ohio. This variation in average installed cost across states, as well as comparisons with Japan and Germany, suggest that markets with large PV deployment programs tend to have lower average installed costs for residential PV, though exceptions exist.
The report noted three incentive programs in California that are encouraging solar installations in new construction: the Emerging Renewables Program, the New Home Solar Partnership Program, and the California Solar Initiative, and confirms that solar has gone mainstream, with 88% of systems connected to the grid. The LBNL report finds that overall, the main driver in recent cost declines has been the cost of PV panels themselves, as opposed to other components that solar systems require.
The report contains a wealth of charts and graphs to fascinate the solar wonk. You can download the 50-page report as a PDF file.
Wind picking up
Also this week, the American Wind Energy Association (AWEA) released third-quarter figures (PDF download) for large-scale wind energy installations, logging 1,649 megawatts (MW) of new power generating capacity. The figure shows growth from the previous quarter and a running total of 5,800 MW of new capacity for the year, so far.
California clocks in at third among states with the most installed wind capacity, behind Texas and Iowa–but the Golden State does not place in the top five, in recent growth.
AWEA continues to voice consternation over a longer-term tailing off in wind turbine construction and manufacturing, especially in the U.S:
…the 5,000 MW now under construction is nearly 38% lower than the over 8,000 MW under construction at this time last year. A firm, long-term national commitment to renewable energy is still needed for the U.S. to become a wind turbine manufacturing powerhouse and create hundreds of thousands of jobs.
AWEA calculates the total operating wind power capacity in the U.S. to be about 31,000 MW, enough to power “the equivalent of nearly 9 million homes, avoiding the emissions of 57 million tons of carbon annually and reducing expected carbon emissions from the electricity sector by 2.5%.” Average power consumption per household varies considerably from state to state.
