 This post also appears at Climate Central, a content partner of Climate Watch.
Global temperatures continued to increase in 2009, and atmospheric greenhouse gas levels also rose, according to a new “State of the Climate Report” from the US National Oceanic and Atmospheric Administration (NOAA). The report, released today as a supplement to the Bulletin of the American Meteorological Society, offers a detailed look at last year’s major weather and climate events, and reviews long-term global climate trends. Overall, it paints a picture of a world that continues its long-term warming trend, albeit with considerable variability from year-to-year.
The report finds that the earth warmed more last year than in the preceding two years, and reiterates the conclusion that the first decade of the 21st century, 2000-2009, was the warmest decade on record, both at the earth’s surface and in the lower atmosphere.
The State of the Climate report attributes many of the significant weather and climate events of 2009 to natural variability. For example, the return of El Niño, a periodic cycle of ocean warming in the tropical Pacific which influences global weather patterns, helped increase global temperatures. It states that El Niño may account for much of last year’s global increase in temperature compared to 2008 — about 0.1 degrees Celsius warmer in 2009.
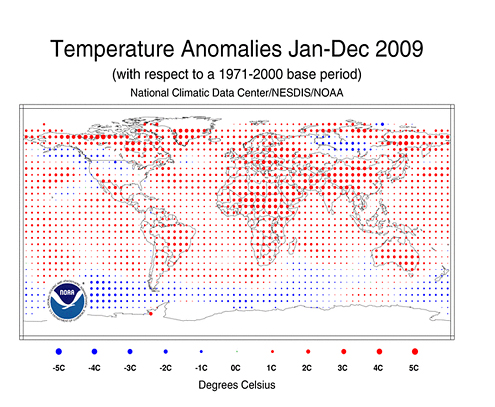
“Global surface temperatures in 2009 saw a return to near-record levels as the cooling in the tropical Pacific associated with the 2007/08 La Niña event gave way to strengthening El Niño conditions in 2009,” the report states. The average global land and sea surface temperatures for 2009 was about 0.5 degrees Celsius warmer than the average between 1961-1990.

Surface temperature anomalies, Jan.-Dec. 2009. Click on the image to
see a larger version. (Source: NOAA/NCDC)
The abundance of warmer-than-normal water in the Pacific also contributed to the most active storm season there since 1997, while the Atlantic saw a relatively quiet season in 2009.
While NOAA publishes its State of the Climate reports annually, the 2009 version differs from previous years with its focus on a specific series of climate change indicators, such as global average air and ocean temperatures and ocean heat content. Tracking this group of metrics illustrates the long-term trends that are the hallmarks of climate change.
“For the first time, and in a single compelling comparison, the analysis brings together multiple observational records for the range of carefully selected indicators we would expect to change with surface temperatures,” said Dr. Peter Thorne, a co-author of the report and climate scientist at North Carolina State University, in a press release.
Examples of climate indicators investigated by NOAA:
- Air temperature over land
- Air temperature over sea
- Troposphere temperature
- Sea surface temperature
- Ocean heat content
- Sea level
- Snow coverage
- Sea ice extent
These indicators are bound to fluctuate from year to year, however. For example, the last decade may have been the warmest on record, but 2009 was not the hottest year ever recorded (though it managed to tie 2006 for the fifth spot since instrumental measurements began in the 1850s). Furthermore, 2009 saw a slight recovery in the extent of Arctic sea ice.
But when each year is lined up next to all the preceding years, NOAA said, these short-term variations are small compared to the clear and significant long-term warming trend.
“Despite the variability caused by short-term changes, the analysis conducted for this report illustrates why we are so confident the world is warming, ” said Dr. Peter Stott, a co-author of the new report in a press release. Stott is the team leader of the Climate Monitoring and Attribution group of the United Kingdom’s Met Office Hadley Centre, which contributed to the NOAA report.
The report itself was authored by more than 300 scientists from every continent and from 160 research groups around the world.
So far, the data for 2010 shows no let-up in sight for warmer than average global temperatures. As this summer drags on, the planet has already recorded its warmest year-to-date, with several record-breaking heat waves in the US, Asia and the Middle East. Along with April and May, June was the hottest such month on record worldwide.
With this year already off to a hot start and on a pace to surpass 2009 in terms of global temperature averages, Stott says the long-term trend sends a clear message: “When we follow decade-to-decade trends using multiple data sets and independent analyses from around the world, we see clear and unmistakable signs of a warming world.”
In addition, the report responds to questions during the past year from critics of climate science who have questioned the veracity of the surface temperature record. “Globally averaged surface temperature anomalies are shown to be robust given the close agreement between independently-derived datasets and strong corroborative evidence across a wide range of other climate variables,” it states, adding that the conclusion that the world is warming does not rest solely upon surface air temperature records. Evidence that the oceans are storing greater amounts of heat, sea levels are rising, atmospheric humidity is increasing, and land and sea ice is melting all point to a warming climate as well.
“If the land surface records were systematically flawed and the globe had not really warmed, then it would be almost impossible to explain the concurrent changes in this wide range of indicators produced by many independent groups,” the report states.
