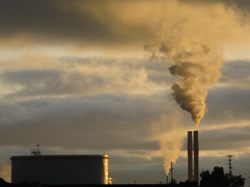
Carbon addiction is the same as any other in at least one respect: the first step to recovery is admitting you have a problem. For greenhouse gases, reducing emissions requires knowing what you’re putting out to begin with.

It was toward this end that this week the California Air Resources Board released the first comprehensive data on large-scale industrial carbon emissions in the state. Not surprisingly, the top emitters tend to fall into two categories: power plants and oil refineries, with cement manufacturers not far behind.
Individually, major oil refineries have the largest carbon footprint. Two of Chevron’s refineries–in Richmond and El Segundo, BP’s Carson refinery and the Shell refinery in Martinez, all clocked in at more than three million metric tons (tonnes), CO2-equivalent, for 2008.
Use the interactive map below, prepared by Climate Watch intern David Ferry, to locate the largest industrial emitters and see how they sort out by industry (We’ve been having difficulty with embedded maps vanishing from the blog, so if you don’t see the map below, just click on the link to it).
(Click here for a larger map and a list of all the largest emitters.)
View KQED: California’s Biggest Industrial CO2 Emitters of 2008 in a larger map
Cumulatively, electric power generation is California’s biggest emitter, despite the virtual absence of coal-powered plants in the state. The ARB report lists nearly 20 utility or industrial cogeneration plants in the million-plus club. Several plants put out more than two million tonnes, including Dynegy’s gas-fired plant at Moss Landing, the LaPaloma McKittrick plant, Southern California Edison’s Mountainview plant in Redlands, and the L.A. Department of Water & Power’s Haynes Generating Plant.
The federal EPA considers anything above 25,000 tonnes to be a large emitter. But with carbon emissions, “large” is a relative concept. California imports power from other states and we can get a clue to “large” from the carbon output numbers on some of the mostly coal-fired plants feeding the California grid from states like Utah and Wyoming. Some fossil fuel plants in those states weigh in at a hefty six, ten–even 15 million metric tons. Los Angeles still depends on out-of-state fossil plants for roughly half of its electric power.
A few large cement plants are also in the million-plus column. To find out why, listen to Amy Standen’s report for Quest.
Of course, all this careful accounting leaves aside the elephant in the room: transportation, which has a bigger footprint in California than all electrical generation combined, including imports from other states–and is about equal to total industrial emissions.
The industrial tally released this week is subject to revision and will be used to set caps and allowances for the carbon trading (cap & trade) system mandated by the state’s 2006 Global Warming Solutions Act, commonly known as AB-32. There’s more on the emissions report and what it means in Paul Rogers’ story for the San Jose Mercury News.
3 thoughts on “California’s Biggest Carbon Emitters”
Comments are closed.

There is no Rosemead, CA, power plant owned by Southern California Edison. That power plant is called Mountainview and is located in Redlands, CA.
Good catch. Our information came directly from the data released by the Air Board, which I now see lists Rosemead as the location of all six SCE generating plants (our map includes only the largest emitter). Rosemead is where Edison’s corporate offices are located. Looks like several of the utilities reported their sites in this way. We’ll run this down and update the map, thanks.