upper waypoint

New Climate Research Suggests Acceleration of Sea Level Rise

Save ArticleSave Article
Failed to save article

Please try again

San Francisco tide gauges
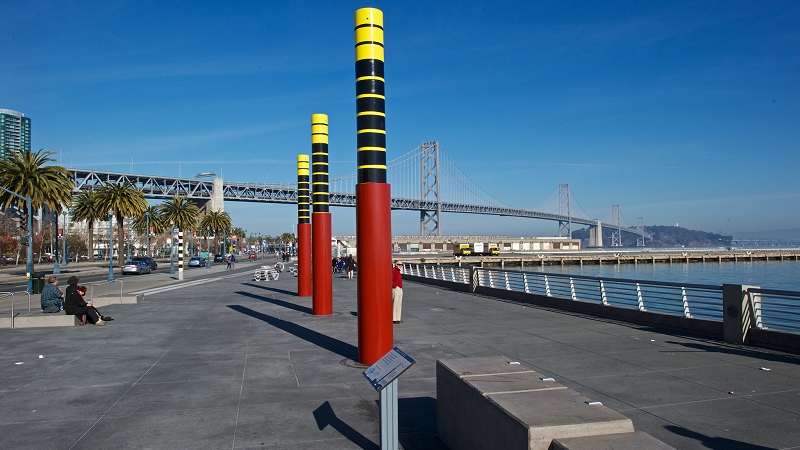
Tide gauges at the Brannan Steet Wharf, San Francisco. Sea level is the result of a complex set of forces and influences on land, on the seafloor and in the water between them. Estimating sea level rise from imperfect data is a scientific challenge that may progress through more sophisticated statistics. (Dave R/CC-BY-NC)

A reassessment of historical data suggests that compared to previous estimates, the world’s sea level rose more slowly during the 20th century—and is rising faster now.

Sea level is one of those things that grows more complex with closer scrunity. Jerry Mitrovica, a researcher at Harvard, tells his audiences to step way back and think of sea level only as the distance between the seafloor and the sea surface. Both of those end points are known to move up or down (relative to the Earth’s center) for reasons that have little to do with the actual amount of water between them. Sea level science is the task of untangling all of those reasons and measuring their precise effects on where the water sits against a particular piece of shoreline.

Here’s a partial list of the things known to affect sea level. The position of the seafloor may change, just like the land, because of erosion or deposition of sediment. The weight of ice caps pushes the Earth’s crust downward while the surrounding crust rises, like an air mattress in a swimming pool when a child climbs aboard it—and the reverse happens when the ice melts. The land near the sea may rise or fall with human-caused changes like groundwater pumping, or as sediments naturally compact. Finally, different parts of the Earth’s crust rise, fall and move sideways with the activities of plate tectonics.

The amount of water in the sea itself may increase or decrease as rivers (and reservoirs) rise and fall, and as ice caps grow and shrink. At the same time, the density of seawater changes with its temperature.

The surface of the sea itself is changeable. Persistent weather patterns and oceanic currents pile up water in some places and pull it down in others. The water surface is extremely sensitive to the gravity of everything around it—the moon and sun create its well-known tides, and the gravity of large ice caps adds a slight gathering force to the seas around them that disappears as the ice melts.

Sponsored

In measuring all of this, we rely today on historical records from tide gauges in many coastal cities as well as contemporary, broad-scale data from satellites. The old tide records are a noisy, imperfect data set with limited coverage on the map and time gaps of missing measurements. Each point of data has various degrees of uncertainty, some of them poorly known. For instance, building a new harbor near an old tide gauge can change how the water acts around it. (Satellite orbits, and the system that tracks them, are prone to their own set of uncertainties.)


Video: QUEST’s “Watching the Tides” from its Science on the SPOT series.

The task of scientists is to zero in on these error sources and learn how to correct them, with a view toward approaching as closely as possible a clean clear truth. It’s a two-sided task. One side is getting better data, and the other side is making better mathematical models to fit against the data.

The most widely accepted studies of tide-gauge records have said that 20th century sea levels rose, on average, between 1.6 and 1.9 millimeters per year. This is fine, except that it’s about one-third greater than the sum of its parts—the various factors I mentioned. The budget of causes and effects is not closed.

In the latest issue of Nature, three climate researchers from Rutgers University and Mitrovica took a new statistical approach to the tide-gauge data from the last century. Called Kalman filtering, it handles a noisy data record by giving more weight to the most trustworthy evidence. (Kalman filtering is spreading across Earth science, offering a new look at many old problems.) It uses the mathematical sea level models to help correct the tide-gauge data.

The team’s results put 20th century sea level rise at about 1.2 mm/yr, right where the models say it should be. This may or may not be a comforting coincidence, and other researchers will want to check the results themselves in their own ways. It bolsters what the big climate reports from the IPCC have been saying about rising sea level.

On the other hand, the Nature analysis confirms that more recent sea level rise, as estimated from satellite data, is also correct—and since 1990, the sea has been rising much faster than the 20th century average. That is, the sea level curve, graphed through time, looks more like the “hockey stick” of global air temperature. If the Kalman approach is repeated and more widely accepted, the truth looks more inconvenient than ever.

PS: Sea level researchers extend their work into the geologic past, too. The Pliocene Epoch, 3 million years ago, is the last time in Earth history that atmospheric CO2 was as high as today, and in the Pliomax project Mitrovica is gathering evidence from the eastern U.S. about that ancient time.

lower waypoint
next waypoint
Homeowners Insurance Market Stretched Even Thinner as 2 More Companies Leave CaliforniaSame-Sex Couples Face Higher Climate Change Risks, New UCLA Study ShowsWatch Ferns Get FreakyAs California Seeks to Legalize Psychedelics for Therapy, Oregon Provides Key LessonsHoping for a 2024 'Super Bloom'? Where to See Wildflowers in the Bay AreaCalifornia’s Commercial Salmon Season Is Closed Again This YearInsurance In California Is Changing. Here's How It May Affect YouThese Face Mites Really Grow on YouWhere to See Cherry Blossoms in the Bay Area This SpringThis is NOT a Dandelion.