Geologic maps look as solid as the ground itself, with their crisp lines and firmly colored bedrock units. But geologists face the same bewildering world as the rest of us. Although they can see and visualize the bones of the land better than we can, mapping geology is as much a creative, interpretive act as an observational one. A paper in the current Bulletin of the Seismological Society of America brings that home with a fresh look at a hundred years of geologic mapping in a high-stakes neighborhood: the leafy suburban town of Portola Valley, where the San Andreas fault tore the land apart in 1906.
The great earthquake of April 18, 1906 was intensively studied by Bay Area geologists who were present in large numbers at UC Berkeley and Stanford University. Once the rubble at Stanford was under control, Professor John C. Branner and his students fanned out into the nearby foothills to document the fresh fault ruptures there. Branner compiled the results on a map and submitted it to Professor Andrew Lawson at UC Berkeley, who was preparing a master report funded by the Carnegie Commission. The work went on, the Stanford people went back to their lives and studies and Lawson’s “Carnegie Report” was issued in 1908.
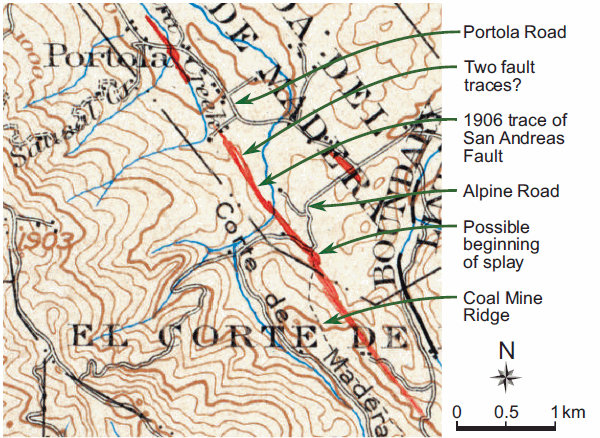
The Carnegie Report has stood for more than a century as a monument in seismology. It was the first and last word on the fault for many years. In fact, geologists did not return to the fault in Portola Valley for another fifty years. When they did, things began to get fuzzy. Roads had been rebuilt, buildings replaced, earth moved and trees planted as the open farmlands turned to wooded suburbs. With the 1906 rupture long smoothed over, the new geologic mappers relied on the landscape as well as the Carnegie Report to reconstruct the fault as best they could. Subtle features, perhaps thousands of years old, were added to the fault—sometimes as older or secondary fault traces, sometimes as the active trace. A body of research, much of it unpublished, began to grow. New maps modified old ones, and each new mapper made fresh modifications.
Along with the science, the laws grew up around the fault. The 1972 Alquist-Priolo Act required all active faults in the state to be mapped and construction-free zones set up around them. With that, the exact location of an active fault trace became a crucial matter in real estate. Trenching studies were done for new construction projects, some of which found the fault and some of which didn’t. Discrepancies and interpretations continued to multiply, and the fault turned into a tangle of lines on geologic maps.
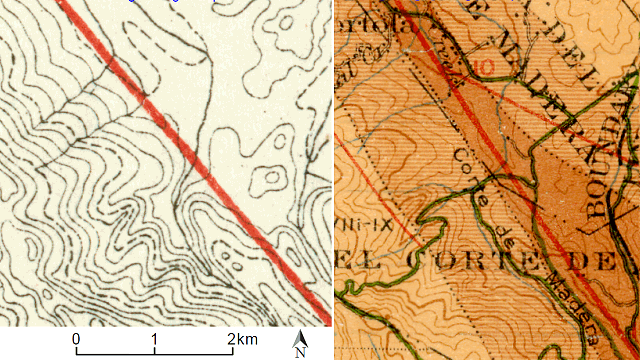
By the turn of this century, it was clear that someone needed to take the whole thing again from the top, reanalyzing the original materials and assessing all the literature. How was the fault lost? Where did it really rupture in 1906? The job would take time, persistence and the judgment of a seasoned researcher. That’s what retired geologists are good for, and Chet Wrucke, emeritus scientist at the U.S. Geological Survey, happens to live in Portola Valley. He had access to the 1906 archives plus a new lidar map of the area showing the ground stripped bare.