upper waypoint

Explainer: The 8 Stations in the Northern Sierra 8-Station Index

Save ArticleSave Article
Failed to save article

Please try again

Water rushes at the Feather River Fish Hatchery in February during an emergency release of water from Lake Oroville.  (Josh Edelson/AFP-Getty Images)

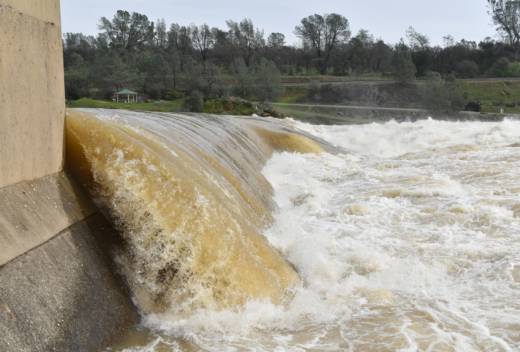
If you're an inveterate rain watcher, or almost any other kind, you've probably read somewhere that an important index of Northern California precipitation has set a new record.

The name of that somewhat arcane statistical measurement, a product of the California Department of Water Resources, is the Northern Sierra Eight-Station Index.

On Thursday, the index hit an all-time high -- 89.7 -- exceeding the mark of 88.5 set in the rainy season of 1982-83. On Friday, the index stood at 90.2, and, with more wet weather certain to visit the North State, that number will continue to rise.

We've seen lots of references to the index this season, though no explanation of what it actually represents. Is it a simple mean of the eight stations? Or is there some sort of algebraic voodoo thrown in to flummox D students?

Doug Carlson, a DWR spokesman, answered the question this way: "Every day, the accumulated precipitation among the stations is totaled up, and then divided by eight."

Sponsored

OK, then: a simple average reflecting the rainfall (and water content of snowfall) at the eight stations for the current water year, which begins on Oct. 1 and runs through Sept. 30.

Next question: What stations are involved and why?

The eight sites are scattered across the Sacramento, Feather and American river watersheds. They're generally very, very rainy-snowy spots compared to what we're used to in most of the Bay Area. Brush Creek, northeast of Oroville, is one of the Feather basin sites. It has recorded a mind-boggling 121 inches of precipitation since last Oct. 1.

The watersheds themselves are tracked because it was recognized when the index was created in 1920 that rainfall they were the sources of an abundant water supply. In later decades, they became the key basins for the federal Central Valley Project and the State Water Project.

Below are the eight sites the Department of Water Resources uses in the Northern Sierra eight-station index. Try as we might to find the exact gauge numbers DWR is using, we have to concede that the numbers below represent only a close approximation of what the agency has produced. In some cases, the official index uses gauges whose readings don't appear to be online or are not up to date. Individual station data are for April 13, 2017.

Station Basin '16-'17 Precipitation
April 13, 2017 Index 89.7
Mount Shasta City Sacramento 56.14
Shasta Dam Sacramento 90.14
Mineral Sacramento 92.80
Quincy Feather 73.11
Brush Creek Feather 120.97
Sierraville Feather 57.63
Blue Canyon American 125.60
Pacific House American 101.15

lower waypoint
next waypoint
Why Nearly 50 California Hospitals Were Forced to End Maternity Ward ServicesStunning Archival Photos of the 1906 Earthquake and FireDemocrats Again Vote Down California Ban on Unhoused EncampmentsFirst Trump Criminal Trial Underway in New YorkFederal Bureau of Prisons Challenges Judge’s Order Delaying Inmate Transfers from FCI DublinJail Deaths Prompt Calls To Separate Coroner And Sheriff's Departments In Riverside CountyRichmond Passes 45-Day Retail Moratorium on Tobacco to Deal With 'Excessive Smoke Shops'The Beauty in Finding ‘Other People’s Words’ in Your OwnAmid FAFSA Mistakes and Delays, Universities Struggle to Help StudentsSF’s Equity Program Fails to Address Racial Disparities in Cannabis Industry