It doesn't take a drought to become obsessed wondering how much water is in California's reservoirs, but it helps. Water levels in the extensive network of artificial lakes is edging up as the state awaits the arrival of a lackluster Pacific storm on Tuesday — with the possibility of a stronger system arriving for the weekend. But reservoirs are perilously low as the state nears the end of what's typically the wet season and faces a long, long stretch before fall rains can be expected.
If you are a reservoir obsessive, you probably already know about the state Department of Water Resources Daily Reservoir Storage Summary. The summary doesn't show you everything that's happening with California water. Rather, it's a quick take on 44 key storage sites, from Shasta Lake and Lake Oroville — the two biggest reservoirs in the state and crucial to Central Valley farms and cities from the South Bay to Southern California — to relatively modest-sized sites like Hetch Hetchy, the key reservoir for residents of San Francisco and most of the Peninsula.
Today's summary shows the 44 reservoirs collectively at 62 percent of normal for the date. That may not sound so bad — hey, it's nearly two-thirds of what we usually have, right? To understand how scary that level is, you need to look at the Sierra Nevada snowpack, which typically holds at least half of all the water that will flow to the state's farms and cities each year. DWR's daily summary of snow-water equivalents shows the snowpack at just one-fourth of its normal level. With so little water stored in the mountains, runoff will be much lower than normal and the reservoirs won't see the typical spring-early summer surge. Those lake levels we see today? They won't be improving much over the next month or so, and then we'll begin drawing them down as we move into summer.
How did we get here?
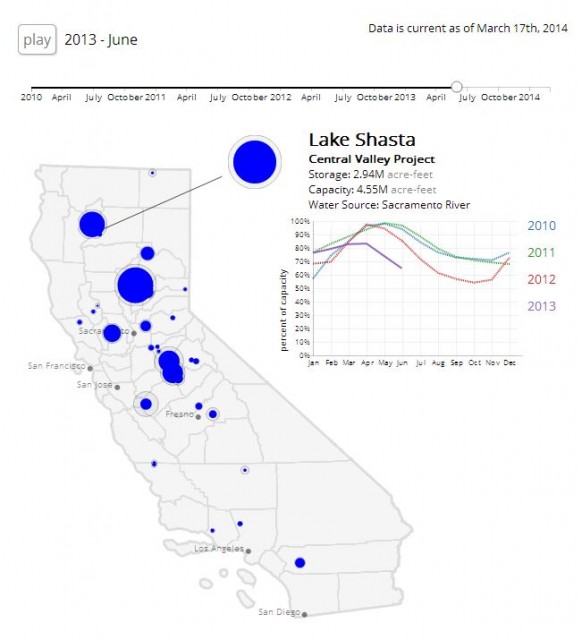
KQED's The Lowdown blog has published a cool visualization by web developer Victor Powell. It depicts the rise and fall of the key reservoirs during rainy years (2010 and 2011) and the current series of dry, drier and driest years (2012-2014) and dramatizes how low the water level is at a key point in the season. Click on the screen grab below for the full interactive visualization.