We'd prefer that our city by the bay be known as the home of brilliant tech innovation, counterculture trends and culinary delights. But a recent report from the Brookings Institution confirms that San Francisco also is earning its other, less desirable reputation as a kind of ground zero for rising income inequality.
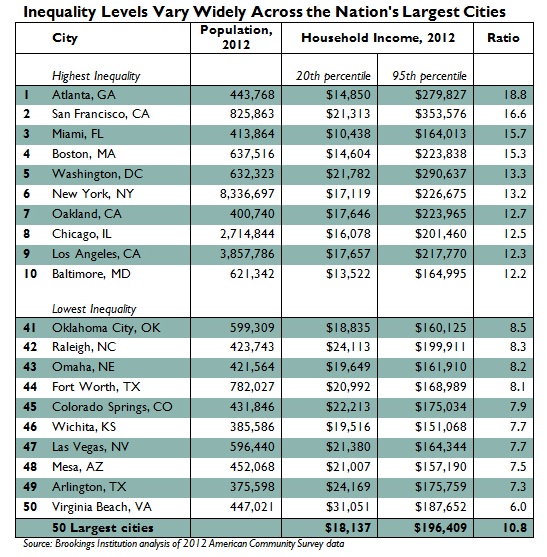
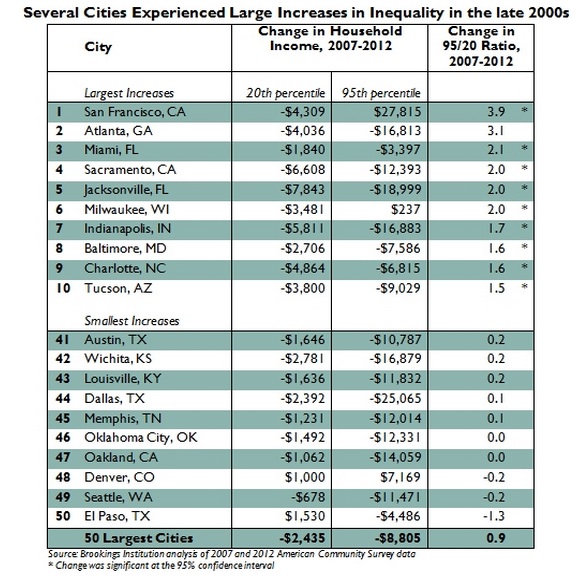
The findings: When it comes to income, San Francisco is the second-most-unequal among American cities, after Atlanta. And in no other city has the rich-poor divide widened more in recent years. (Oakland, meanwhile, is not so far behind, ranking seventh on the list nationally. But the gap has not widened appreciably in recent years. San Jose, in the heart of Silicon Valley, ranks far down the complete list, No. 36; the rich/poor gap also grew far slower there than in San Francisco.)
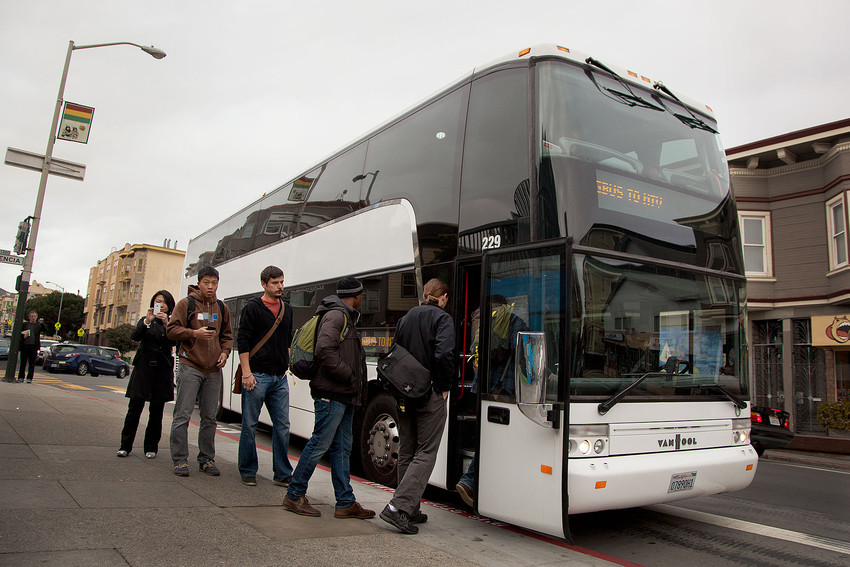
When the report's author, Alan Berube, senior fellow and deputy director in Brookings' Metropolitan Policy Program, decided to run the numbers on income inequality nationwide, he was inspired in part by coverage of the tech bus protests in the Mission District.
Berube tapped U.S. Census data for his analysis, and he chose a particular measure to compare the haves and have-nots: the "95/20 ratio." It's a comparison between the income that puts a household in the 95th percentile, or the top 5 percent, and the income that puts one in the bottom 20 percent. Berube explained that comparing those extremes helps us gauge the severity of the distance in between.
The picture he found was stark. In the most unequal cities -- Atlanta, San Francisco, Miami and Boston, in that order -- residents at the top earned at least 15 times the income of those at the bottom. In San Francisco, for instance, the top 5 percent of households earned more than $353,000 per year, whereas the bottom 20 percent of households mostly earned less than $21,000.