By Karen Billings, Vice President of Education, SIIA
Despite having to contend with deep budget cuts, schools are able to maintain current levels of technology growth, a surprising find from a recent survey by the Software & Information Industry Association.
In its annual Vision K-20 Survey, which included 1,600 responders and comparisons over three years of data, SIIA found that education institutions are maintaining their level of investments in each of the five measures of progress: Enterprise Support, 21st Century Tools, Anytime/Anywhere Access, Differentiated Learning, and Assessment Tools.
This year’s survey showed some surprising trends in the industry:
- Although participants say current technology use lags behind their ideal level, schools are continuing to implement technology despite budget cuts. Some likely reasons: they're using existing technology; they're turning to free or inexpensive digital content and resources; they're redirecting funds from things like print materials for digital resources.
- Results showed an increase in technology integration that focuses on differentiated instruction, assessment tools, and information systems, suggesting these areas are priorities for schools. These include tools like learning management systems, online tutoring, online assessments, e-portfolios, and data-tracking systems.
- The survey items that are closest to ideal integration, including broadband and security systems, may suggest that school- and district- wide goals are more attainable than individual classroom goals, like new hardware. This supports the commonly held notion that district personnel have prioritized Internet access, student privacy, and security when making tech decisions.
- Overall, 24 percent of all participants report that their institutions are integrating technology at a high level.
Comparing the data and results from the survey’s 2009 inception to today, it’s evident that overall progress toward Vision K-20 goals continues to be very slow. While increases and decreases have been recorded for various benchmarks in both K-12 and post-secondary, the changes year to year have been relatively minor. SIIA analysis suggests that while schools have made progress, rapid technology innovations make it difficult for schools to achieve the highest levels of technology implementation.
The areas that did see growth reflect an increased emphasis on assessments and accountability in schools. Survey respondents rated their current level of technology implementation on a scale of 1-4, with 1 being the lowest level of integration and 4 the highest. The four benchmarks that saw the most growth include:
- Courseware and/or learning management systems that are used to differentiate instruction (average 2.07 from 1.91). This confirms the recent interest and growth of adaptive curriculum tools that allow for personalized learning and instruction.
- Student information systems that track performance and institutional data for educational accountability and decision making (2.49, up from 2.35 in 2010).
- Institution leaders that use technology tools for planning, budgeting, and decision making (2.52 from 2.42).
- Technology-based assessments that measure a full range of 21st Century skills and knowledge (2.01 from 1.9).

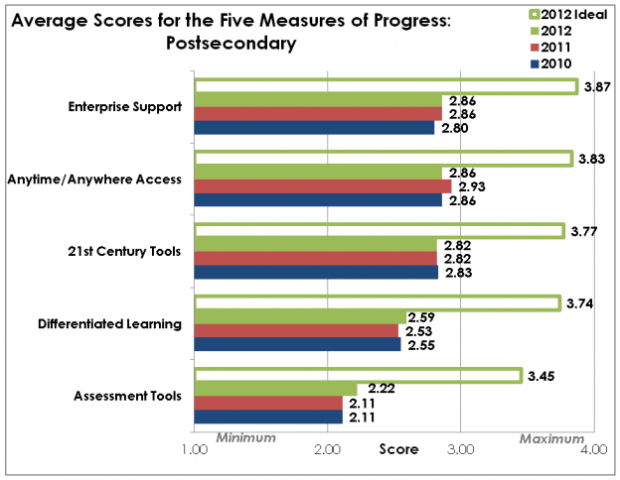
The survey also showed, for the fourth year in a row, a marked difference between K-12 and post-secondary institutions in the adoption of technology. The average scores for the 2012 survey were 2.39 for the K-12 segment and 2.71 for post-secondary (on a scale of 1-4), meaning post-secondary institutions are integrating new technologies faster then K-12 institutions.


