Welcome to the world of traffic waves, a phenomenon that's been exasperating drivers since cars started rolling off Ford's assembly line a century ago.
On average, Americans spend upwards of 40 hours a year stuck in traffic, according to Texas A&M's annual mobility study. That figure rises to more than 60 hours in some of the most congested metro areas, like Los Angeles, Washington D.C. and -- yup, you guessed it -- San Francisco. And, contrary to popular belief, much of this congestion is NOT because of major impediments, but simply a result of annoying driving habits that arise when there are just too many cars on the road.
The simplest explanation for why traffic waves happen is that we drivers have relatively slow reaction times: if the car in front of you suddenly slows down, it'll likely take you a second or so to hit the brakes. The slower your reaction time, the more you have to brake to keep a safe distance. Same deal for the car behind you, which has to brake even harder than you did in order to slow down that much faster. And so on down the road, like a domino-like effect.
To illustrate this concept, Lewis Lehe, a civil engineer and programmer, created the above visualization.
The equation he uses is known as the Intelligent Driver Model, which was first proposed in 2000 by researchers at Germany's Dresden University of Technology (the designers created this Java applet demonstration).
The formal equations that explain these traffic patterns in terms of individual behavior are called car following models. They were first developed by researchers at General Motors in the 1950s. This is the simplest such formula:
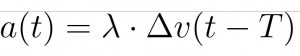
Here, a is the car's acceleration, Δv is the difference in velocity compared with the car behind it, T is reaction time and ƛ is some constant that researchers estimate from data. The equation says, "At time t, you accelerate at a rate proportional to the difference in speed between your car and the speed of the car you're following, but with a gap of T seconds."
Put simply, if you're going faster than the car in front of you, then you slow down. And if you're going slower, you speed up.
This equation produces the graph below. At the 10-second mark, the grey car slows down, and the cars that brake later have to slow down to subsequently lower minimum speeds. Each line shows the history of the speed of a different car. Drag the slider to graphically see a traffic wave unfold. Note how the cars at the bottom of the chart get closer together with time, as speeds even out.
Over time, congestion researchers have developed more complex models of traffic behavior that include realistic conditions and incorporate additional traffic data. For example, our "simple" equation assumes that the car in front of you will impact your behavior even if it's a mile away. Some of the first improvements to the equation added terms for the size of that gap and the understanding that cars can slow down much faster than they can speed up. You can read more about the history of car-following models here.
Lewis Lehe is a PhD student in Civil Engineering at the UC Berkeley, where he researches electronic road tolling and runs the Visualizing Urban Data idealab.
