upper waypoint

Eight Great Multimedia Resources for Teaching about Climate Change

Save ArticleSave Article
Failed to save article

Please try again

President Obama joined leaders and diplomats from more than 190 countries who convened in Paris today to kick off a two week effort towards negotiating an international climate change agreement. The United Nations' sponsored event, the largest gathering of world leaders in history, is an urgent, sweeping attempt to reduce global carbon emissions and stave off the worst consequences of climate change.

2015 is on track to be the warmest year on record.  In fact, nearly all of the warmest years on record have occurred since 2000. During that time, the frequency of extreme weather events -- from droughts and floods, to hurricanes and freezes -- have also risen significantly. The vast majority of scientists agree that these changes largely stem from a rapid increase in greenhouse gas emissions, primarily from the burning of fossil fuels.

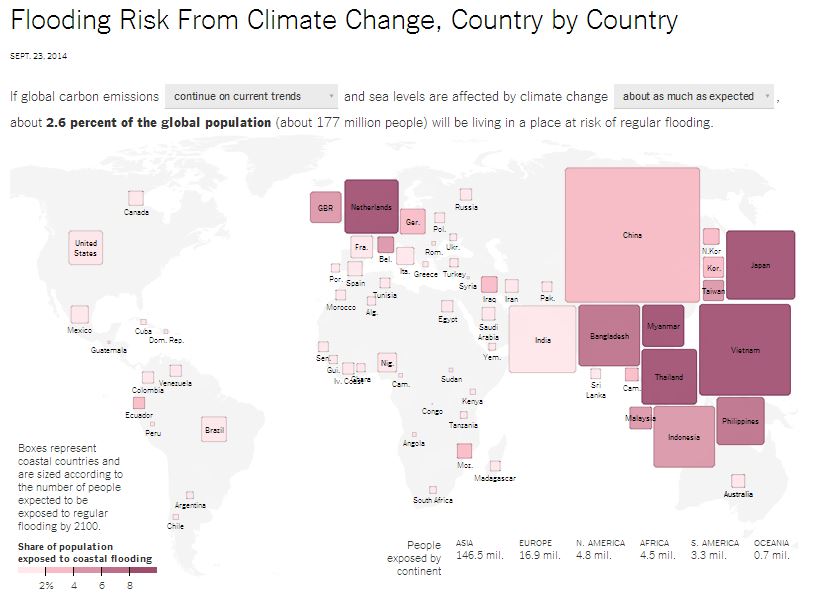
Perhaps the greatest inequity of the crisis is that those least responsible for contributing to climate change -- people of the world's poorest nations -- will likely continue to be the most adversely impacted by its consequences.

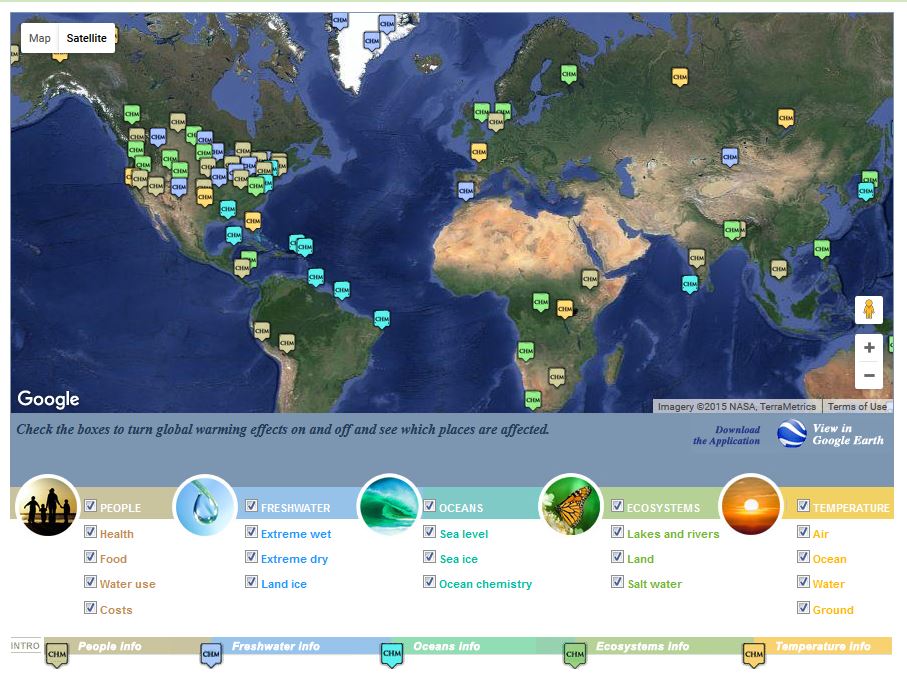
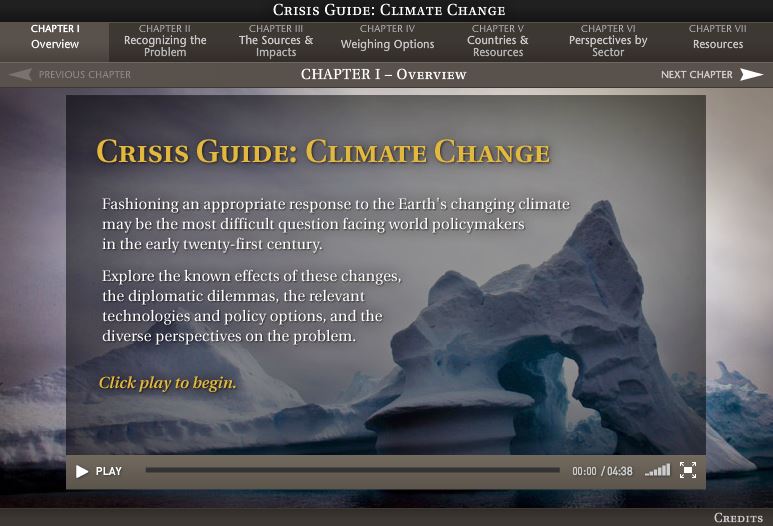
Explore the issue in greater depth with these excellent interactive resources from around the web.  Additionally, click here to download a series of KQED Science Education e-Books on the science of climate change.

Climate 101

A good short explainer on the basic science of climate change, narrated by celebrity scientist Bill Nye ("the Science Guy") and produced by the Climate Reality project.

Sponsored

Climate map: the global culprits and victims

The Carbon Map was created by Duncan Clark and Robin Houston from the design firm KILN as an entry in the World Bank’s Apps for Climate competition. Recently updated and featured on The Guardian's site, the map resizes the world's geography so as to reflect the nations that are most responsible for climate change and those most vulnerable to its impacts. Click the PLAY button to see a demo. Listed below the map is a collection of additional interactive climate change resources.


NASA's Climate Time Machine

A series of visualizations showing how some of the world's key climate indicators like global temperature, sea ice and carbon levels have changed over time.

Carbon story

Produced by the Global Carbon Project, this visualization shows the past, present and future of carbon production and its environmental impacts.

carbon story - Copy

Flooding risks

The NY Times interactive team put together a country by country map of flooding risks due to climate change, using data from an analysis conducted by Climate Central.

Upshot - Copy

Climate Hot Map

Produced by the Union of Concerned Scientists, this map tracks climate change-related impacts in locations around the world. Indicators include heat waves, sea-level rise, flooding, melting glaciers, earlier spring arrival, coral reef bleaching, and the spread of disease.

ucs

How hot has it gotten in your lifetime (and how much hotter will it get)?

Also created by Duncan Clark from Kiln (and featured on the Guardian), this interactive shows predicted temperature changes in your lifetime.


Climate change crisis guide

An extensive interactive guide on climate change, produced by the Council on Foreign Relations.

CFL

lower waypoint
next waypoint
Why So Many Central Americans Are Seeking Asylum in the U.S.Real-Time Interactive Earthquake Map: Get to Know Your Local FaultsIt's Really Happening! This Is What KQED's Youth Takeover Looks LikeWhen Rivers Caught Fire: A Brief History of Earth Day (with Lesson Plan)A Look Inside the Youth Vaping CrazeIt's Almost Tax Day. This Is How the Government Spends Your Hard-Earned CashIs the Endangered Species Act at Risk of Extinction?March Madness and the Money: Should College Athletes Get Paid?How to Stop a Nuclear War: The Non-Proliferation Treaty, ExplainedMAP: What Does the U.S.-Mexico Border Really Look Like?