upper waypoint

How Much Water Do Californians Use and What Does 25 Percent Less Look Like?

Save ArticleSave Article
Failed to save article

Please try again

Photo courtesy of NASA

Feeling a bit dry lately? It's not just your imagination.

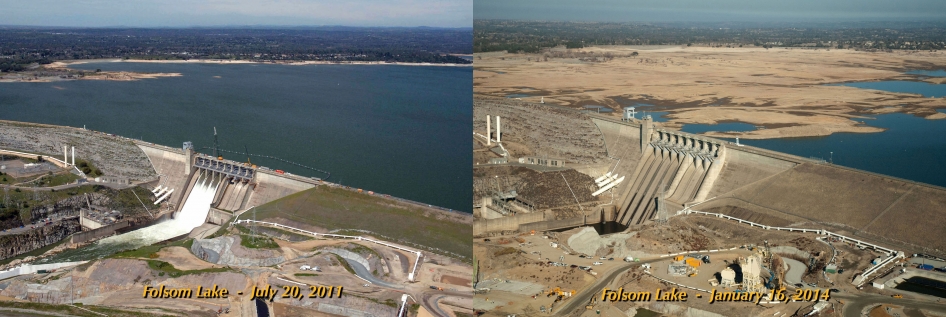
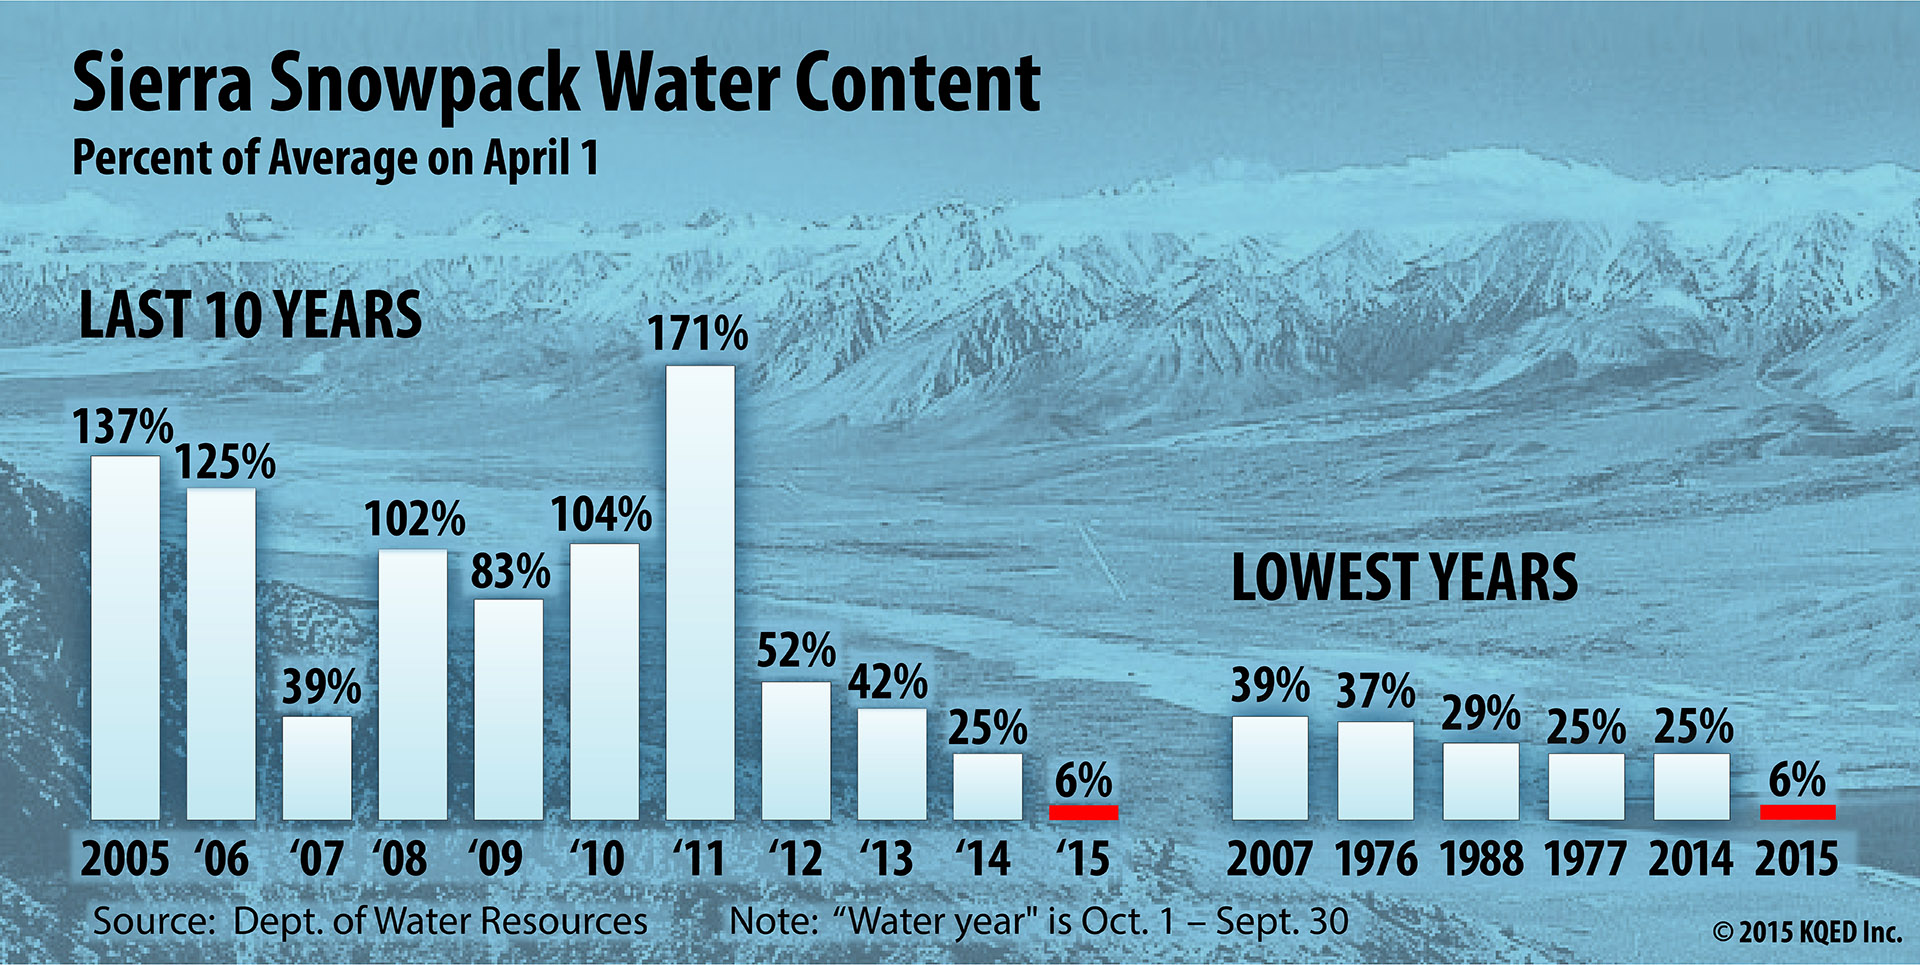
California is mired in its fourth year of historic drought, with snowpack in the Sierra Nevada -- which supplies about a third of the state's water -- at 6 percent of the long-term April average.

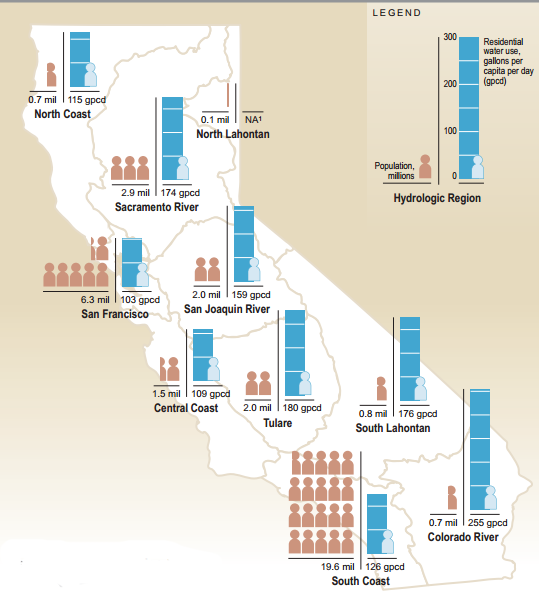
From a grassy mountain meadow usually blanketed with feet of snow, Gov. Jerry Brown on Wednesday observed the dismal snow survey results before announcing California's first ever mandatory statewide water reductions. The executive action mandates the state’s 400 local water supply agencies, which serve roughly 90 percent of California residents, to reduce urban (non-agricultural) water consumption by 25 percent of 2013 levels over the coming year. The reductions will likely vary by community, based on significant differences in per capita water consumption from region to region. Keep in mind, though, that residential water use is just a small fraction of the state's total water consumption -- with roughly 80 percent of all water resources used for agriculture, and the remainder split between residential and commercial/industrial uses.

[The NY Times produced an interactive map of winter and summer water use rates in various cities and water districts throughout California].

But that begs some important questions: namely, how much water does the average Californian actually consume and what would a 25 percent reduction look like?

Sponsored

It's a hard figure to quantify, and estimates vary widely. For one, while indoor residential water use is relatively steady throughout the state, outdoor use -- primarily for landscape irrigation -- varies dramatically, with homes in arid inland regions consuming significantly more water than those in coastal areas.


"There are large variations across the state," notes Peter Bostrom from the California Department of Water Resources. "Outdoor use could be 25 percent [of a household's use] in Santa Cruz and 80 percent is Coachella." 15 percent of users, he adds, account for 60 percent of overuse in landscape irrigation.

Source: California Dept. of Water Resources_Water Plan (2009)
Source: California Dept. of Water Resources; Water Plan (2009)

Additionally, estimates are typically represented as gallons per capita per day (gcpd). Water use in each of the state's 10 hydraulic regions is divided by population (see map at right). These calculations, however, generally factor in each region's total water consumption, which includes residential water use as well as commercial and industrial uses.

One the best ways to get a handle on your own household's water consumption is by carefully scrutinizing you water bill, which usually includes the number of gallons used that month. The East Bay Municipal Utility District is among several local agencies that offer good interactive forms for how to read your bill.

An often-cited 2011 study of single-family water consumption, estimated that the average California household used more than 360 gallons of water per day. To put that in perspective, the typical office water cooler holds 5 gallons, or about 1.4 percent of the study's estimated daily average household use. Given that figure, the average house in California would need to use about 90 fewer gallons a day (or 18 water coolers) to meet the governor's 25 percent reduction mandate.

The 2011 study, sponsored by CDWR and managed by the Irvine Ranch Water District, logged water consumption in the year 2007 for 735 homes spread across the state's 10 hydraulic regions.

It found that about 53 percent of total average household water use -- or more than 190 gallons per household per day -- was used for landscaping and other outdoor uses (this is just the state average -- most cities in the Bay Area use significantly less).

Meanwhile, Indoor use accounted for more than 170 gallons per household per day. Not surprisingly, the most in-home water consumption was in toilet flushes. A more shocking finding, however, was the whopping 18 percent lost to leaks inside homes. Data from the study is represented in the charts below.


lower waypoint
next waypoint
Why So Many Central Americans Are Seeking Asylum in the U.S.Real-Time Interactive Earthquake Map: Get to Know Your Local FaultsIt's Really Happening! This Is What KQED's Youth Takeover Looks LikeWhen Rivers Caught Fire: A Brief History of Earth Day (with Lesson Plan)A Look Inside the Youth Vaping CrazeIt's Almost Tax Day. This Is How the Government Spends Your Hard-Earned CashIs the Endangered Species Act at Risk of Extinction?March Madness and the Money: Should College Athletes Get Paid?How to Stop a Nuclear War: The Non-Proliferation Treaty, ExplainedMAP: What Does the U.S.-Mexico Border Really Look Like?