upper waypoint

The World Cup of Nearly Everything Else: How the 32 Competing Countries Compare Off the Field

Save ArticleSave Article
Failed to save article

Please try again

worldcup_everything

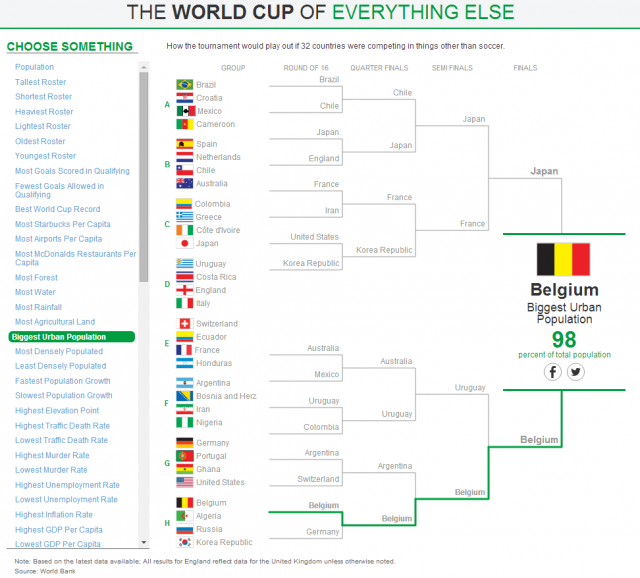
If there was a World Cup of tree nut consumption, Iran would dominate the competition (92 calories per capita per day). That's according to the data whizzes at the Wall Street Journal, who adapted the World Cup's grouping and bracket structure to show how the tournament would play out if the 32 qualifying countries were competing in 70 very random categories, most having nothing to with soccer (or "football" as the rest of the world seems to call it).

When you select any of the categories in the left-hand rail of the interactive chart, the brackets  automatically reformulate, revealing the ultimate “winner.” Drawing from a range of different data sources (listed at the bottom of the chart), the findings are fascinating.

For example, while the United States isn't expected to make it too far in this year's Cup, at the end of the day, it'll still hold the title (compared to the other 31 nations) of most Starbucks per capita (3.65 per 100,000 people), most McDonald's per capita (4.48 per 100,000 people) and -- perhaps not unrelated --  highest adult obesity rate (33%).

And while Cameroon suffered a heartbreaking 1-0 defeat to Mexico on the second day of the soccer tournament, the outcome would have been quite different had the two nation's competed in a bean-eating contest (at 192 calories of beans per capita per day, Cameroon dominates that field).

Sponsored

Among the many other obscure revelations:

Russia chirps like a bird and drinks like a fish: it has the most cellphone subscriptions per capita (1.84) and the highest rate of alcohol consumption (15.1 liters per person per year). Argentina really likes the taste of flesh (570 calories of meat per capita per day). Greece smokes like a chimney (2,795 cigarettes per adult per year). And the Netherlands is one lactose-loving, cyber-obsessed nation (456 calories of milk per capita per day and a web-use rate of 93%).

lower waypoint
next waypoint
Why So Many Central Americans Are Seeking Asylum in the U.S.Real-Time Interactive Earthquake Map: Get to Know Your Local FaultsIt's Really Happening! This Is What KQED's Youth Takeover Looks LikeWhen Rivers Caught Fire: A Brief History of Earth Day (with Lesson Plan)A Look Inside the Youth Vaping CrazeIt's Almost Tax Day. This Is How the Government Spends Your Hard-Earned CashIs the Endangered Species Act at Risk of Extinction?March Madness and the Money: Should College Athletes Get Paid?How to Stop a Nuclear War: The Non-Proliferation Treaty, ExplainedMAP: What Does the U.S.-Mexico Border Really Look Like?