2013 provided endless journalistic opportunities for number-crunching and data-based storytelling. Below, in no particular order, are 10 memorable visualizations featured this year on The Lowdown.
1. The Math of Trash, an Animated Music Video
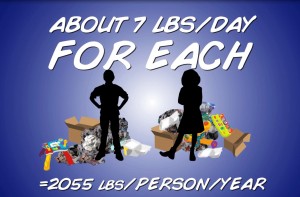 How much trash do you think you produce in a day? How about a year? It adds up a lot faster than you might think — especially in the United States, which collectively generates more garbage — or municipal waste — than any other nation on earth. With only five percent of the world’s population, America creates roughly 25 percent of the planet’s waste.
2. What Are Traffic Waves and Why Do They Happen So Much?
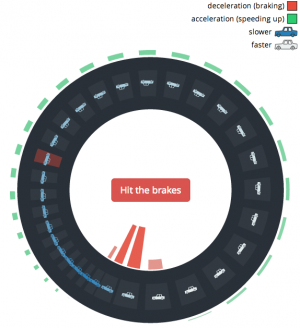 Who doesn’t love sitting in traffic? Especially when there’s no apparent reason for it: no crashes, no tolls, no flaming mattresses. Just a sudden and infuriating slowdown of the cars ahead, causing you to slam on the brakes, spill coffee all over yourself and slow to a glacial crawl, usually when you’re already late for something important — a job interview, for instance. Pure gridlock. And then, when all hope seems lost, the congestion breaks as seemingly spontaneously as it began.
![]() Earlier this month — back in the good ole’ days when our government was actually functioning (sort of) — the U.S. Census Bureau released a series of 2012 income data for American households (and no, I can’t provide the link, because the Census site is still closed for business). The figures shows that despite the nation’s supposed economic recovery, average American household incomes didn’t really budge from where they were the year before. Meanwhile, the poverty rate remained at roughly the same level as it was in 2011 as well.
Earlier this month — back in the good ole’ days when our government was actually functioning (sort of) — the U.S. Census Bureau released a series of 2012 income data for American households (and no, I can’t provide the link, because the Census site is still closed for business). The figures shows that despite the nation’s supposed economic recovery, average American household incomes didn’t really budge from where they were the year before. Meanwhile, the poverty rate remained at roughly the same level as it was in 2011 as well.
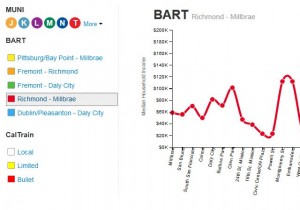 As Bay Area commuters once again brace for the possibility of a prolonged BART strike and look to alternative transportation means, it seems apropos to feature this innovative multimedia piece: a collection of some of the region's major public transit lines and the dramatic income disparities that exist among the communities living along those routes.
5. Rot and Rubbish: The Rancid Truth About How Much Food We Waste  It's almost as if we like wasting it as much as we enjoy eating it. About a third of all food in the world that's produced for human consumption (roughly 1.2 billion tons) is lost or wasted, based on United Nations' estimates - even as millions still suffer from chronic hunger.
6. The Math of Percentages and Discounts Explained in Three Animated Acts
 Quick shopping quiz: That $130 pair of shoes you’ve been eyeing for weeks is now marked down 20 percent. To sweeten the deal, you have a coupon for 10 percent off your entire purchase. In other words, you’re looking at a discount of: 10% off 20% off $130. So … how much would you end up paying?
7. A Global Map of Legalized Gay Marriage
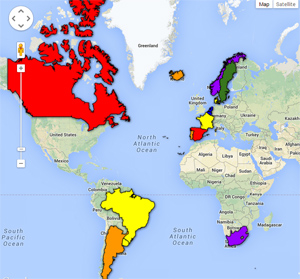 In June, the U.S. Supreme Court let California proceed with same-sex marriages, making it the eleventh state where gay couples can legally wed. The court’s ruling, however, does not impact marriage laws in the remaining 39 states that haven’t extended marriage rights. While public support for same-sex marriage has grown steadily, the U.S still has a long way to go before it joins the ranks of the 16 other countries — spanning five continents — that have enacted national same-sex marriage laws. In 2001, the Netherlands became the first country to legalize the practice.
8. Why America Stopped Making Its Own Clothes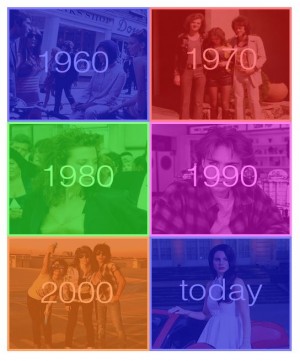 Try this on for size: In 1960, an average American household spent over 10 percent of its income on clothing and shoes – equivalent to roughly $4,000 today. The average person bought fewer than 25 garments each year. And about 95 percent of those clothes were made in the United States.Fast forward half a century.Today, the average American household spends less than 3.5 percent of its budget on clothing and shoes – under $1,800. Yet, we buy more clothing than ever before: nearly 20 billion garments a year, close to 70 pieces of clothing per person, or more than one clothing purchase per week.
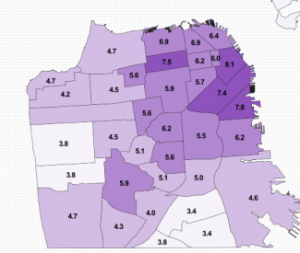 Looking for an apartment to rent in San Francisco? Brace yourself. Last year, the City by the Bay earned the dubious distinction of having