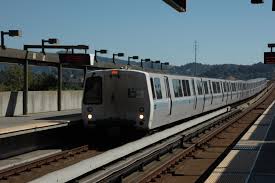
Unions representing BART workers are lobbying for their first pay raise since the last contract four years ago. BART management, meanwhile, wants workers to contribute to their pensions (currently they don't contribute anything) and to pay more for health care coverage (workers now pay a flat-rate of $92, regardless of how many dependents). Negotiators claimed to have reached consensus on pay and benefits by Thursday night, but talks broke down over last-minute workplace rules proposed by management, according to a spokesperson for the Service Employees International Union.
The five-day strike in July, which hobbled transportation throughout the Bay Area, came about after negotiators failed to reach an agreement before the expiration of the old contract. Trains started running again only after Governor Jerry Brown ordered a 60-day cooling off period.
How long this strike might last? It's anyone's guess.
According to recent polls, residents in the generally labor-friendly Bay Area have shown an overall lack of public support for the demands of BART employees. The dearth in sympathy stems, in part, from the fact that average annual gross pay among BART union workers is -- at $76,551 -- is not only higher than that of any other major transportation agency in the state, but also tops the average salaries of any other public agency in the Bay Area (transportation or otherwise), according to the San Jose Mercury News' public employee salaries database.
The charts below use the Merc's data to compare average gross pay across agencies. The figures include the salaries of both management and union workers, which, as some readers have insightfully noted, are somewhat deceiving in that they don't give an accurate representation of what unionized workers (isolated from management) actually make. This data are available in the Merc's database, but would need to be parsed per individual agency, which I have not done in these charts except for BART.
The charts are intended to place the salary data in a context. Take a look -- hopefully it'll help pass the time if you happen to find yourself sitting in some nasty traffic.
