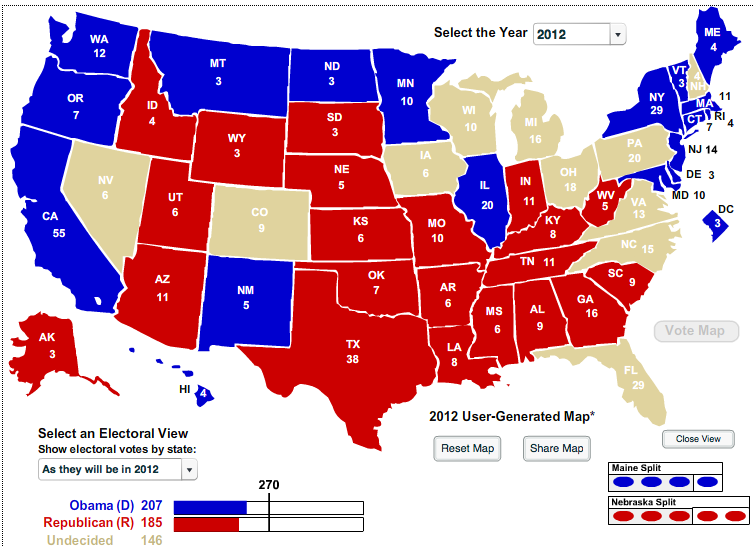
A candidate needs 270 electoral votes to win the election, so in most elections, the race comes down to the battleground states: those toss-ups that are divided pretty evenly between Republicans and Democrats and have lots of unpredictable independent voters. It's these states that typically have been the wildcards in recent elections, the one's with the power to literally "swing" the outcome of a presidential race, and the places you'll very likely find the candidates in the weeks and months leading up to the election.
As in 2008, the biggest swing states this year (the one's with the most electoral votes, that is, and a history of vacillating) are Florida, Ohio, Virginia, Colorado and North Carolina. All of them chose Obama in 2008, and current polls show him retaining a slim lead in most. The individual outcomes, though, still remain very much up in the air.
There are a ton of good interactive electoral maps out there (so I'll restrain myself from creating another one). I particularly like the Los Angeles Times interactive, which provides an electoral calculator, a clear breakdown of past election results, and an interface users to play with different swing state scenarios.
270ToWin, which I've referenced in past posts, also has a great set of maps and resources, including state-by-state historical voting patterns. The site includes an interesting electoral college prediction calculator based on current polling numbers.
Additionally, the BBC has a great interactive to learn more about battleground states, their populations, and the most compelling issues that might sway voters there.
So, then, what are the main factors that determine how a swing state might lean in a given election? There are many, of course, but among the most influential is the economy equation, A lot of voters evaluate the sitting president's performance on current economic conditions (even if those trends had already taken shape prior to a president assuming power). Because the U.S. economy continues to be sluggish, and unemployment rates are particularly high in key swing states like Ohio, many of the on-the-fence voters who chose Obama in 2008 will likely be quite a bit harder to win over this time around.