
Students often struggle with picturing a novel’s characters and plot. Often referred to as “making a mental movie,” this skill is vital to getting through a long and complicated piece of literature. When students struggle to picture what they’re reading, reading itself becomes much more challenging.
Every year, I teach Frankenstein to my senior English classes, and it is not uncommon for my students to struggle to imagine the story as we read it. Most of them have never been to Europe. Nor are they typically familiar with the streets of Geneva or the weather conditions of the Swiss Alps. How can I expect them to feel the bitter cold of the howling mountain winds as the Creature tracks Victor, if they can’t fathom the distance between Switzerland and the North Pole, or picture the mountain ranges looming over Europe?
To address this issue, I have often asked students to do rudimentary contextual research before starting a novel, which I then have them use to produce short presentations using Google Slides. This works pretty well, though it won’t result in their interacting with the material as much as I’d like. When working with Slides, they’ll typically copy and paste the information (and hopefully cite it!), but they won’t work with the information in any meaningful way. And if I ask them about their presentations a few days later, they’ll often scramble to pull up their work again, having completely forgotten what they said only a few days before.
The KQED Making Interactive Maps Course
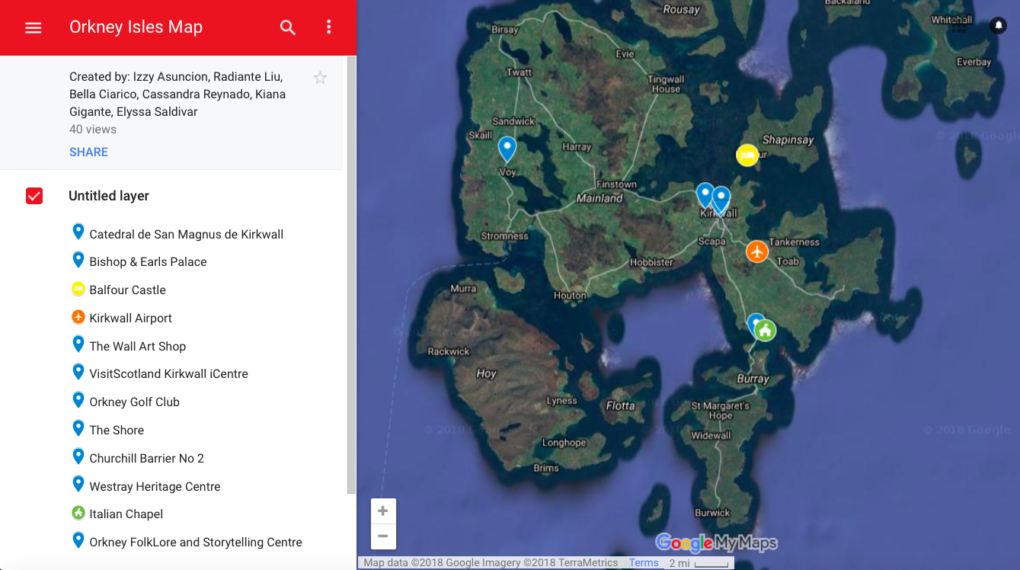
As a KQED Teacher Ambassador, I’m encouraged to poke around the KQED Teach platform, and to take as many courses as I can. I started with the course Making Interactive Maps chiefly because of the word “interactive” in the title, and because it can easily be applied to context research. It also seemed like it might be able to solve some of the issues I’ve mentioned around helping students connect with the contextual information they need before starting a novel.
The course clearly lays out the number of modules one needs to complete, and each module has the approximate time commitment listed. I love that you can pick at the course in pieces — in other words, you don’t need to complete everything all at once. You can determine your own pace, and complete the modules and course in whatever time frame works for you. The lessons build on each other, however, so you do need to complete one module before proceeding to the next.
 [/media-credit]
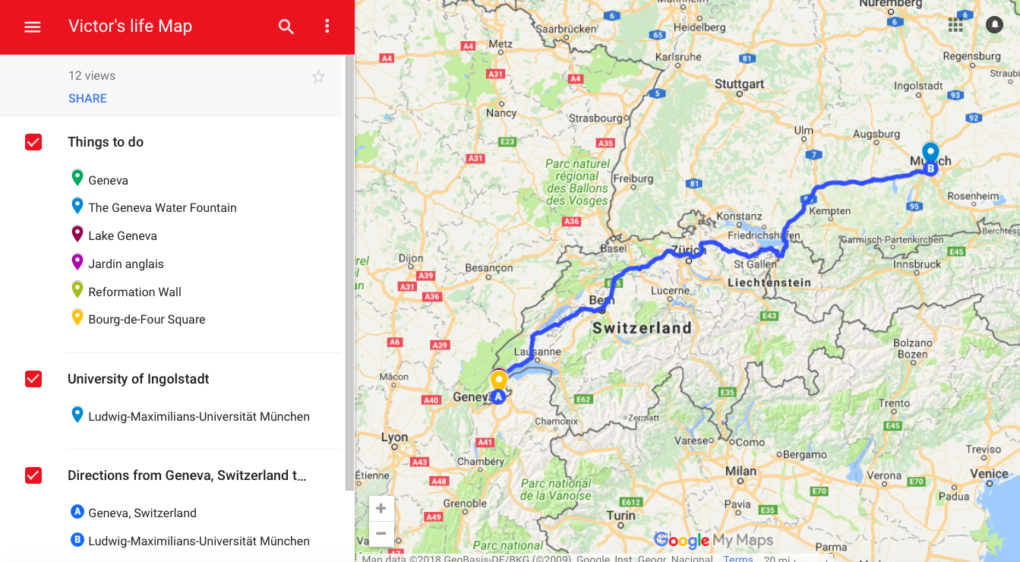 [/media-credit]