upper waypoint

From the Top of the Space Needle: A New View on Carbon Emissions

Save ArticleSave Article
Failed to save article

Please try again

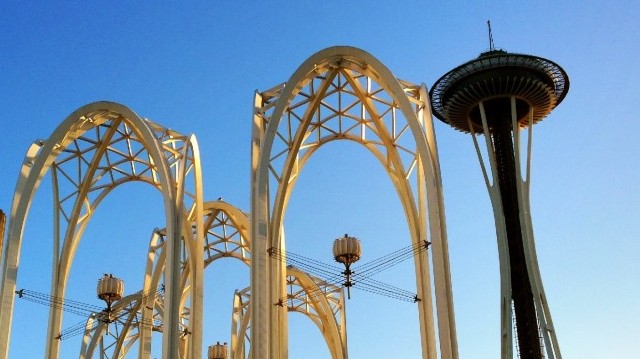
Every five minutes, CO2 measurements are sent from the top of the Space Needle to the the Pacific Science Center (their white arches).  (Photo courtesy of the Pacific Science Center)

New York City made headlines this year with the news that its greenhouse gas emissions dropped by nearly 20 percent over the past decade. Other cities and communities nationwide are also developing climate action plans to reduce carbon dioxide (CO2) levels, but how will they measure their success?
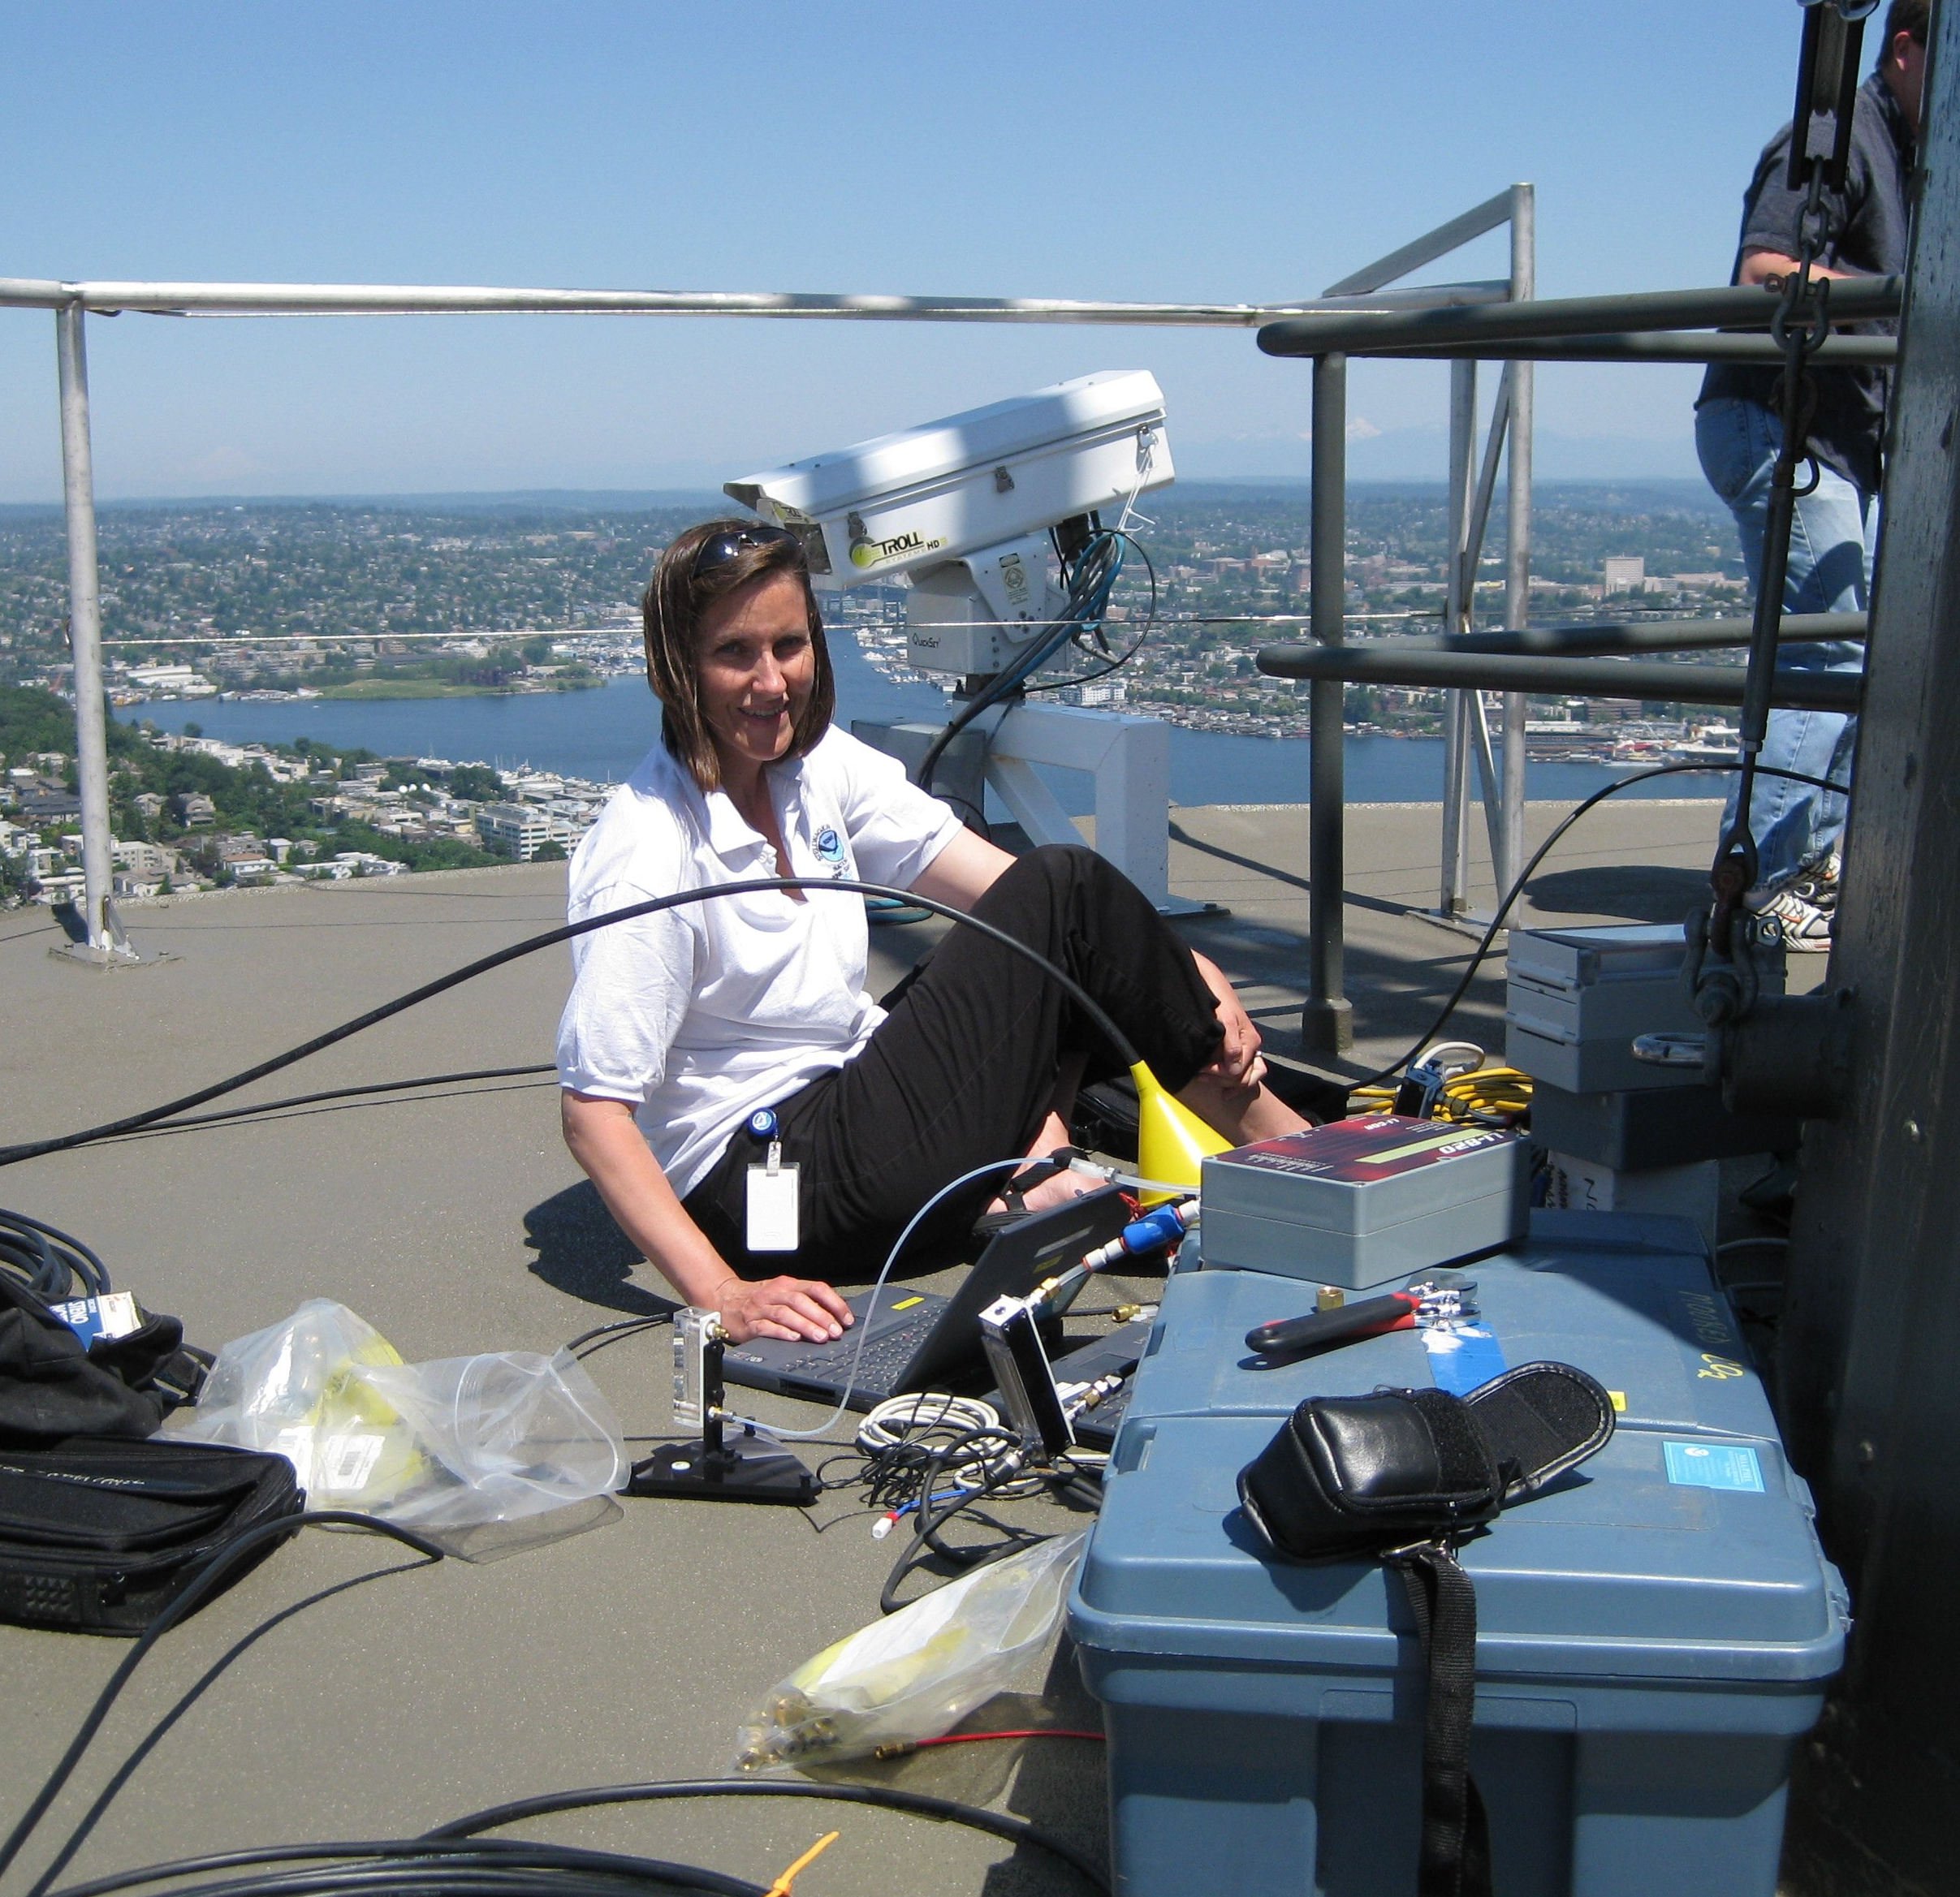
Stacy installing monitor
Stacy Maenner and Chris Sabine helped install the CO2 monitor on top of the Space Needle. Photo courtesy of NOAA.

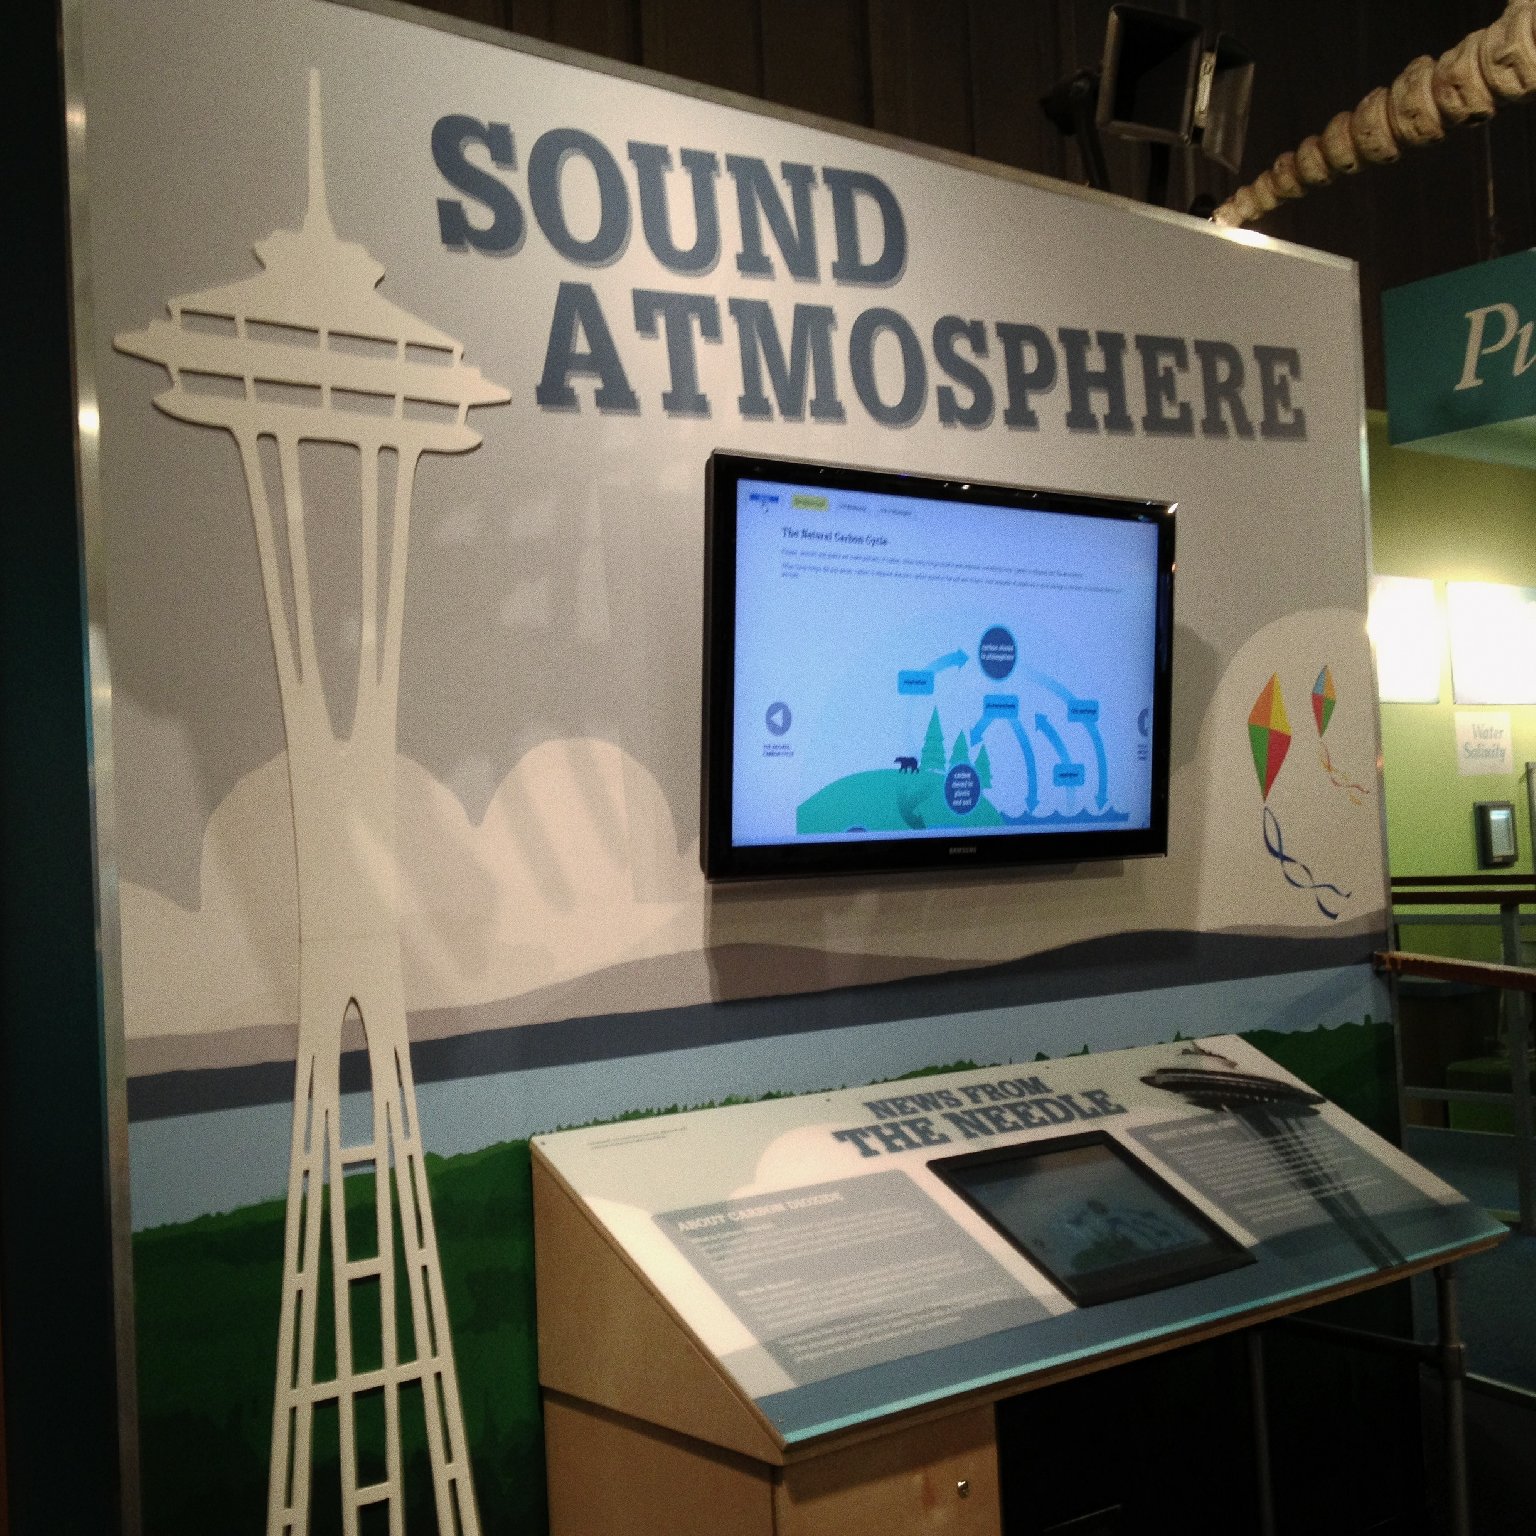
Off the foggy coast of the Pacific Ocean near Aberdeen, Washington, a small monitor sits on a buoy quietly measuring atmospheric CO2. Its sister, a monitor high atop Seattle's iconic Space Needle, does the same. The two monitors create a picture of the carbon emissions generated by our region's population. These monitors allow scientists -- and the public -- to see daily, monthly, and seasonal highs and lows in carbon emissions.

Seven years ago scientists in Seattle installed this innovative system, which lets them analyze real-time data of changing atmospheric CO2 levels and share this information with the public.

In Washington, a state that relies primarily on hydroelectricity to fuel industry, carbon emissions come largely from transportation, industry and residential buildings. This contrasts with most parts of the country, where carbon comes mostly from power plants.
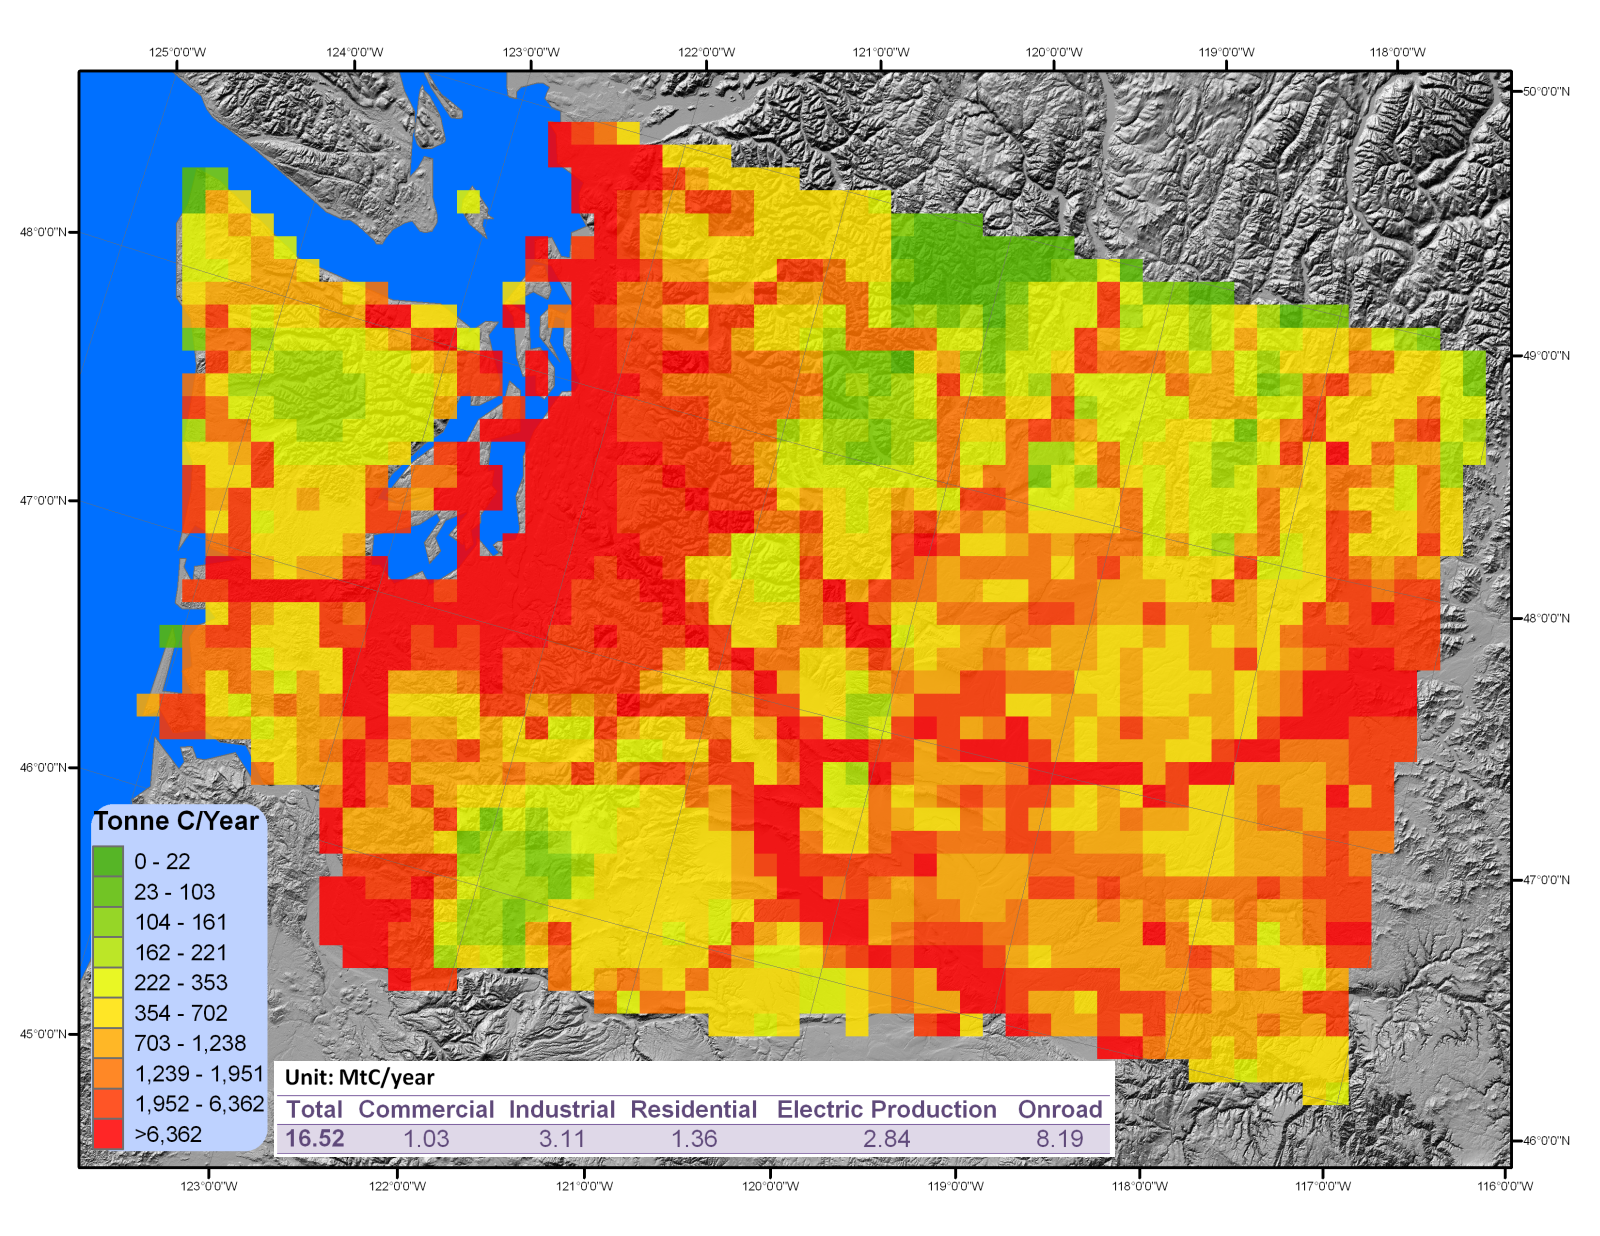
WA Emissions Mobile.png
This map shows Washington State Emissions from transportation sources. The dark red lines also correspond with Washington highways. Photo courtesy of Kevin Gurney. Click to enlarge.

This makes Washington a perfect place for scientists to study the impacts of policy decisions on transportation, industrial and residential emissions, removing the influence of coal-burning power plants.
Sponsored

According to Dr. Ellen Lettvin, Pacific Science Center's Vice President for Science and Education, "The Space Needle is tall enough and central enough to gather meaningful urban data about CO2, whereas the instrument on the buoy collects important observations of the remote marine environment."

With Dr. Christopher Sabine, Director of the Pacific Marine Environmental Laboratory (PMEL), Lettvin arranged to install the Seattle CO₂ monitoring station.

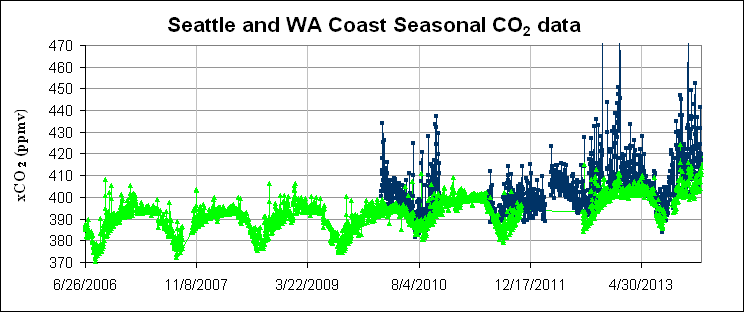
Every five minutes, data from the Seattle monitor is collected and then summarized in daily, monthly, and seasonal graphs. The daily picture shows peaks at commute times, while the seasonal graphs show dips in the spring and summer when urban vegetation absorbs a portion of the CO2. But long-term results show a more disturbing trend.

Seasonal CO2
PMEL's Seasonal CO2 graph shows the CO2 emissions of the coast (green) and of downtown Seattle (blue). Photo courtesy of NOAA.

"The scary thing is that over the last seven years since we have been taking these measurements, the seasonal CO2 low points keeps trending slightly higher each year due to human activity, in both the measurements from Seattle and from Aberdeen," says Lettvin. "The CO2 levels in our region keep climbing, year after year -- just as they are doing worldwide."

PSC kiosk
Pacific Science Center's shows data from the Space Needle's CO2 monitor. Photo courtesy of Pacific Science Center.

Lettvin points out that businesses have much to gain from a better understanding of their CO2 footprints, too.

“Fuel costs keep going up,” said Lettvin, “so if you’re a business or an individual, your CO2 footprint is strongly related to the amount of money you are spending on fuel. Saving money and reducing our individual and collective contributions to climate change are both incentives to reducing energy use.”

Monitors like the one on top of the Space Needle help scientists understand the flow and flux of CO2 in major cities. Individuals, companies, and governments can now make more informed decisions about their emissions, and any progress toward climate mitigation will become clearer.

lower waypoint
next waypoint