upper waypoint

Tracking Your Own Footprints: Digital Tools to Inspire Conservation

Save ArticleSave Article
Failed to save article

Please try again

Oberlin College's citywide edition of the Environmental Dashboard Project.  (Credit: Aaron Kozloff)

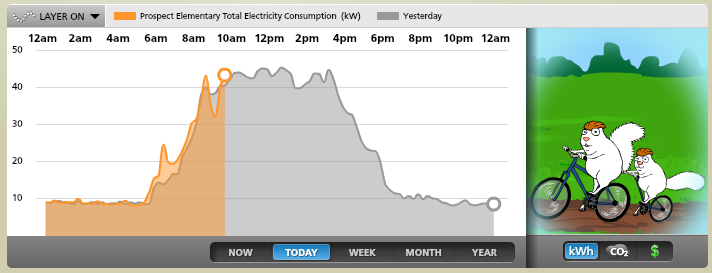
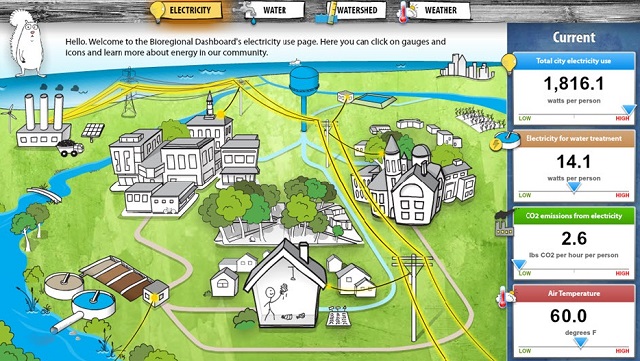
It's Thursday afternoon and a group of fifth graders and their teacher are testing and monitoring water quality in a local stream that flows into Lake Erie. They’re eager learners, in part because of a new feature hanging on the wall of the main hallway at Prospect Elementary in Oberlin, Ohio: an “Environmental Dashboard.” The Dashboard is a digital display that shows real-time electricity and water use in their school building. Students can see how their actions affect the building’s overall use of resources.

As today's kids spend more time with technology and less time outside, their understanding of how they interact with, and are a part of, their ecological system may be decreasing. According to the Oberlin researchers who developed the Dashboard, the goal is to help reconnect citizens with the environmental resources on which our lives depend, and increase their sense of being part of a social community and ecological system.

Prospect Elementary students respond to their Dashboard's real-time report about the school's use of resources. Credit: Hannah Ball-Damberg.
Prospect Elementary students respond to their Dashboard's real-time report about the school's use of resources. Credit: Hannah Ball-Damberg

Inspired by the Dashboard, Oberlin seniors Sam Serazo and Shane Clark assisted teacher Joy Harrison in developing activities centered on “systems thinking” and the water-quality monitoring field trip to the local stream, Plum Creek. Systems thinking emphasizes increased causality and connection among different components of social, ecological, and economic systems. In other words, someone who is a systems thinker is more likely to see their actions as impacting the greater system even if that impact is not immediately visible. In their field trip, students had to form hypotheses about how human activities and weather patterns would impact stream quality and then check their guesses using real-time data displayed on the Dashboard.

In addition to partnering with Prospect Elementary, Oberlin’s Environmental Dashboard Project (of which this author is a part), also extends into many other areas of the campus and community. Dashboards monitor resource flow in college dorms and local organizations, and plans are in the works to bring this technology into individual homes using advanced infrastructure smart meters. "I am a mom and I have two teenage boys, and I am dying to be able to show my kids the graph of their water usage when they shower and compare it to my water usage to show them how much water they use," says Cindy Frantz, associate professor of psychology at Oberlin.

Students from Prospect Elementary pick squash as part of their ecologically-minded curriculum. Credit: Hannah Ball-Damberg.
Students from Prospect Elementary pick squash as part of their ecologically-minded curriculum. Credit: Hannah Ball-Damberg

The Dashboard project leaders hope to expand the screens and monitoring technology to other local organizations and businesses. This broader implementation will not only enable further research but also have the more widespread effect of increasing sustainable behavior in the small town of Oberlin, which has made a commitment to reducing greenhouse gas emissions below zero in an economically viable manner.

Sponsored

This monitoring technology will be useful in providing tangible feedback in order to empower people to change their behaviors and conserve more resources. Recent evaluations suggest that when people receive feedback, they reduce their resource use an average of 10 percent. Frantz noted that there is "evidence to suggest that the Dashboard helps people conserve resources, so that is a benefit to the planet, a benefit to the institution in terms of saving money, and a benefit in terms of teaching young adults how to engage in conservation behaviors."

The Dashboard offers additional features besides monitoring individual buildings and providing feedback, including the ability to provide critical information about resource use to the broader community. A citywide Dashboard component monitors use of electricity and water, as well as water-quality metrics for Oberlin's watershed and local precipitation. Oberlin systems ecologist John Petersen believes that displaying the real-time resource use at the community scale differentiates the Oberlin Environmental Dashboard from other dashboards that focus only on resource use within a single building.

Community Voices, another Dashboard feature, makes visible some of the other sustainability-oriented activities in which people are already engaged but which often go unrecognized. The aim is to empower and engage people and organizations. As Frantz explained it, the goal is to “connect what people really care about in their own communities to these bigger issues of sustainability.” This might take the form of announcements and slideshows at the local public library, she said, among other forms of outreach.

Dashboard
The Dashboard offers Oberlin residents insight into how each person can affect his or her environment. Credit: Aaron Kozloff

Previous research shows that college students who were regularly exposed to the citywide Dashboard had enhanced systems thinking compared to a group that was exposed to a display that contained the same information without the animated resource flows throughout the community. These enhanced systems-thinking dimensions include an increased degree of connectedness with nature, perception of the community as an ecological system, and perceptions of causality and responsibility. This suggests that visual representations of electricity and water flow in a community encourage members of the public to think of themselves and their everyday actions as impacting their community.

Over the coming year students and teachers in four Oberlin public schools will collaborate with Oberlin College students to develop Community Voices content through reflective journals, photojournalism projects, and art. They also plan to use the resource-use graphs and metrics on the Dashboard in future lesson plans for science and math classes, as well as for friendly interschool competitions. Further research will help develop new approaches  to  create mutually beneficial and meaningful connections among communities, their neighbors, and the environment.

lower waypoint
next waypoint