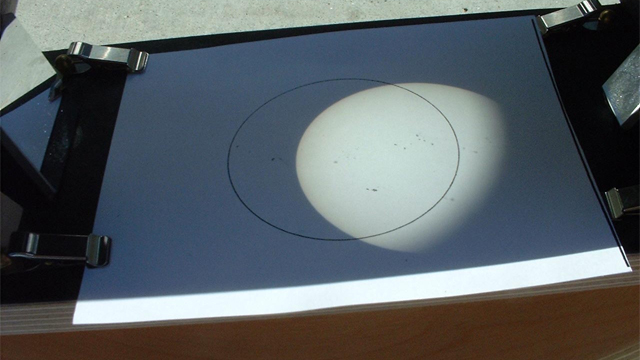
The pattern was always there for me to notice: 1980, 1991, 2002, 2013. See it? I didn't, until in recent years, because noticing the regular pattern of the appearance of sunspots over time requires that you notice the times when the sun isn't so spotty. During those times, the sun simply fell from my attention because there wasn't much to see.
If you've been following the sun lately, you're aware that we're somewhere in the midst of Solar Maximum: that season in the solar cycle of greatest magnetic activity when sunspots and other related magnetic events like solar flares and coronal mass ejections are frequent and pronounced. On average, Solar Maximum comes every 11 years, reaching a singular high in magnetic activity and then relaxing toward Solar Minimum. By the original predictions, Solar Maximum was expected to peak around May of 2013.
However, except for a sharp spike in activity in late 2011, all of 2012 fell below par, appearing on graphs as if Solar Maximum climaxed a year early and is now on the way out.
Did it fizzle, ending unexpectedly early -- and after a performance that fell short of the anticipated mark?
Or perhaps...with a light drum roll...is the drop in activity we've observed lately only a brief calm before a spectacular resurgence?
While some have suggested that we have experienced a tepid Solar Maximum that simply didn't meet market expectations, another explanation is afoot: the sun is getting ready to deal out a "double peak" Solarmax, with the second peak getting ready to ramp up.
If this is the case, Solarmax has yet to give us its finale fireworks display, which we could expect later this year and perhaps crackling on into 2014.
A double-peak Solar Maximum isn't a novelty, as it turns out. In fact, the last two of them (back in 2001/2002, and before that in 1990/1991) exhibited similar behavior. Why? We're still working on the answer to that, but the double-tap maximum may be a result of the sun's two hemispheres, north and south, reaching Solar Maximum at slightly different times. Currently, it appears that the sun's southern hemisphere is lagging behind the north in activity—and maybe getting ready to make up for lost time.
If you're wondering what all this magnetic activity on the sun actually looks like, come up to Chabot Space & Science Center and see for yourself. Our new exhibition, "Touch the Sun" features fully interactive movies of solar activity on a 90-inch color television.
