upper waypoint

Stunning Solar Visualizations: The Sun's Van Gogh-like Artistry

Save ArticleSave Article
Failed to save article

Please try again

Left: Colorized image captured by NASA's Solar Dynamics Observatory (SDO). Credit: NASA/SDO. Right: Visualization, based on the image on the left, using specific colors to describe which areas on the sun cooled or heated over a 12-hour period. Credit: NASA/Viall.

Image of the sun and visualization of temperature changes in the same area
Left: Colorized image captured by NASA's Solar Dynamics Observatory (SDO). Credit: NASA/SDO. Right: Visualization, based on the image on the left, using specific colors to describe which areas on the sun cooled or heated over a 12-hour period. Credit: NASA/Viall.

While nearly all eyes are focused on Mars, two astophysicists at NASA's Goddard Space Flight Center have been quietly staring at the sun instead.

Back in 2010, NASA debuted the Living With a Star program with the Solar Dynamics Observatory, or SDO, a "sun-pointing semi-autonomous spacecraft." SDO sends data back to earth at a continuous 130 megabits per second, seven days a week, twenty-four hours a day. Scientists Nicholeen Viall and James Klimchuk have used some of this mass of information to create solar images worthy of an art gallery.

Solar visualizations, Figure 5A from Viall and Klimchuk 2012
Solar visualizations; Figure 5a from {link url=http://arxiv.org/pdf/1202.4001.pdf}Viall and Klimchuck 2012{/link}

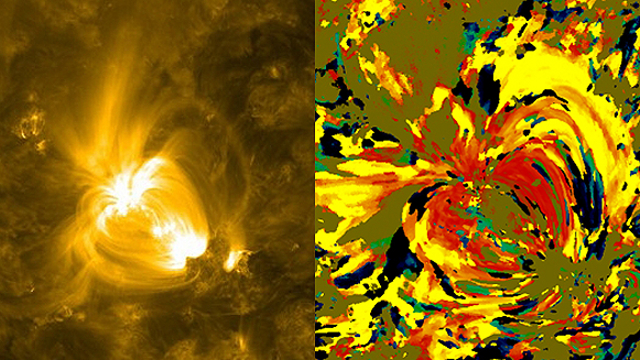
These beautiful pictures, which NASA writer Karen C. Fox calls "reminiscent of van Gogh," are not only fit to hang on your living room wall, but represent a critical step toward solving a major puzzle of heliophysics (that's my new favorite word, by the way): Why is the sun's corona so hot?

As you may remember from childhood sing-a-longs, The sun is a mass of incandescent gas / a gigantic nuclear furnace / where hydrogen is built into helium / at temperatures of millions of degrees. (Fun fact: though most of my contemporaries know that song from the They Might Be Giants cover, I know it from the original 1959 album "Space Songs".)

But the surface of the sun is actually only 6000 degrees Kelvin, while the corona (the sun's outer atmosphere) climbs well above a million. What's the deal?

Sponsored

Scientists have begun to approach this question with painstaking studies of very small bits of the corona called coronal loops. They've found that these loops carry plasma that has been heated very quickly by nanoflare storms. The loops then cool gradually over time.

coronal loops
Coronal loops. Credit: NASA

But is this method of quick heating and slow cooling unique to loops, or does it apply to the corona as a whole? It has been difficult for scientists to study larger areas of the corona in this context, because of the sheer volume of data that must be parsed.

Viall's technique has the brilliance of all good science visualization: condensing a large amount of information into a straightforward image without having to discard anything. A computer program simply follows one pixel at a time through a series of SDO images, calculating the change in temperature over time and then assigning the pixel a representative color. Reds and yellows mean that an area cooled down, while blues and greens indicate that it heated up. (See NASA's video for a visualization of the visualization.)

Viall and Klimchuk found that most of the large area they studied started out super-hot--up to 7 million K, half the temperature of the center of sun--and cooled over the course of a day to under 1 million K. This is what you'd expect from heating via the nanoflare storms characteristic of coronal loops, so it appears that nanoflares may be able to answer the whole question of coronal heating.

Their paper is available for free on the arXiv and for money in The Astrophysical Journal.

My next question is, where can I order one of these heliophysical van Goghs?

h/t to Science2.0

lower waypoint
next waypoint