"Large volumes of water move into and out of San Francisco Bay as the tidal level of the Pacific Ocean just outside the Golden Gate changes each day. When the tide is changing from low to high levels, a flooding current moves water inland from (and through) the Golden Gate. When the tide is changing from high to low levels, an ebbing current moves water from inside the Bay toward (and through) the Golden Gate."
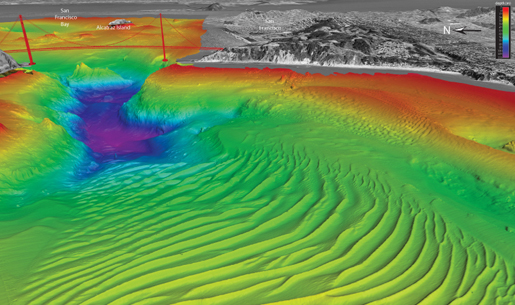
The image above (from Cal State Monterey Bay) is a perspective image looking towards the east. The colors represent water depth with the reds and yellows as shallower water and the blue and purple deeper water. The prominent patterns in the foreground might look like ripple marks on the beach, but these sand waves are similar in scale to some sand dunes seen in deserts -- up to 30 feet tall and more than 700 feet from crest to crest.
The vigorous currents funneled through the Golden Gate continuously move sediment from underneath the bridge where it accumulates as these sand waves. But remember, this is a static snapshot of very dynamic systems. I'd love to see multiple repeat surveys that show how the field of sand waves change over time.
Learn more about the processes that move this sediment from this USGS article and in this SF Chronicle piece from 2006, along with this QUEST story on 3-D seafloor mapping.
~
Images: (1) From USGS Scientific Investigations Map 2917, Under the Golden Gate Bridge -- Views of the Seafloor Near the Entrance to San Francisco Bay; (2) Cal State Monterey Bay Sea Foor Mapping Lab
37.80121220680936 -122.53662873990834
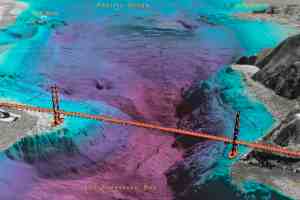 Seafloor under the Golden Gate Bridge, USGS