upper waypoint

H-R: Not just for “Human Resources” Anymore

Save ArticleSave Article
Failed to save article

Please try again

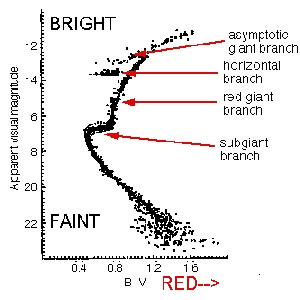
H-R diagram of 47 Tucanae

I started off my last post talking about the well-known properties of globular clusters, but I chose not to dive into the details of the stars inside the clusters. The stars really deserve an article all to themselves. Now is the time for that article.

Basically all of the stars in a globular cluster have the same age and formed under the same conditions. Observations of a globular cluster are a snapshot of one point along the evolutionary track of all these stars. Each star will have well defined properties depending on its mass and the age of the cluster. In the early 1900's, Ejnar Herstzprung and Henry Norris Russell made the first observations of this age and mass relation, thus earning the honor of having the model named after them. Not to be confused with more common corporate acronym, we now refer to the model describing the brightness and color of stars as the Hertzsprung-Russell diagram, or H-R diagram.

The H-R diagram shows the relationship between the brightness of a star and its color. In the figure at the top of this page, the y-axis shows the brightness of the stars in the cluster. The brightest stars are represented by the dots at the top of the figure. The faintest stars are near the bottom. The x-axis shows the color of these stars – red stars are on the right and blue stars are on the left.

All stars start on the main sequence, regardless of their mass. A star on the main sequence is burning hydrogen in its core. The more massive main sequence stars burn much more hydrogen, making them hotter, bluer, and brighter than the lower mass stars. The main sequence stars can be seen as the dots below the objects labeled “subgiant branch” in the H-R diagram at the top of the page. You should be able to see the bluer-brighter relationship that describes the main sequence stars.

Sponsored

The massive stars also consume all of the hydrogen in their cores very quickly, causing them to evolve off the main sequence much sooner than the lower mass stars. The stars that have just evolved off the main sequence are the “subgiant branch”. These stars still burn hydrogen but only in regions away from the core. They mark the turn-off from the main sequence and are used to determine the age of a globular cluster.

The more massive a star is, the further it has evolved from the main sequence in an old cluster. The more massive stars can be seen as the red giant branch, the horizontal branch (burning helium in the core), and the asymptotic giant branch. These stars are all still burning their material through fusion, but appear much different in color, size, and brightness than stars on the main sequence.

Finally, there are some stars that have made a huge jump from the top right hand corner of the H-R diagram to the bottom left. These are the white dwarf stars, seen as the faintest and bluest objects in globular clusters. These stars have burned the last of their available fuel and change from big, cool, and red to very small, hot, and blue very quickly when they purge their outer layers. They no longer burn any material in their cores and are simply radiating the last of their energy left from a lifetime of fusion into space.

I found many good examples of the H-R diagram on the web and you’ll need to run Java on your computer to see my favorite. This is a really cool program that allows you to simulate the evolution of stars. Just give it a mass and watch it go. You can see how it changes brightness, color, and size as it grows old. Check it out!

Kyle S. Dawson is engaged in post-doctorate studies of distant supernovae and development of a proposed space-based telescope at Lawrence Berkeley National Laboratory.


latitude: 37.8769, longitude: -122.247

37.8768 -122.251

lower waypoint
next waypoint