upper waypoint

New State Map Reveals Neighborhood Environmental Hazards

Save ArticleSave Article
Failed to save article

Please try again

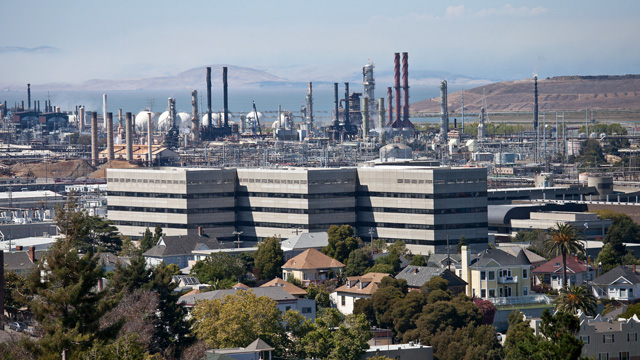
The Chevron Oil Refinery in Richmond, near businesses and housing. (Deborah Svoboda/KQED)

http://www.kqed.org/.stream/anon/radio/tcrmag/2014/04/2014-04-25a-tcrmag.mp3

California has a reputation as a green state, with high air and water quality standards. But depending on where you live, your environment might be bad for your health. A new map from the state Environmental Protection Agency ranks all 8,000 census tracts in California, evaluating each neighborhood and the people who live there to determine their vulnerability to environmental risks. We talk to L.A. Times reporter Tony Barboza, who's covering the new Cal-EPA tool.

Tony Barboza: It's not a huge surprise to a lot of people that some of the most pollution-burdened communities are in places like the San Joaquin Valley, in the urban core of Los Angeles and in the Inland Empire. What jumps out more than the locations generally are just the small neighborhoods. I went to a community this week in reporting this story in the San Gabriel Valley suburb of El Monte. It's just a small neighborhood of houses and apartments where few people there were aware their neighborhood had significant issues with groundwater contamination, cleanup sites, hazardous waste sites. It's not something that people are necessarily aware of that's in their midst. So it really is a tool that gives some perspective to people about what is close to them and perhaps having a health effect.

Scott Shafer: And this didn't just measure things like air pollution, water pollution, groundwater contamination. There were other socioeconomic factors like poverty and levels of education. What is the thinking about including those, and how did that affect the results?

Barboza: I think the state officials who drew this up would probably argue that, by including those, you're not just pinpointing areas that are most exposed to pollution, but the communities that are least equipped to cope with the effects.
Sponsored


Shafer: Well, in fact, in many cases, things like freeways, railway yards, power stations, are put in low-income neighborhoods because those folks have less political clout. This isn't going to change that, right? It maybe puts a finer point on it, and underscores it.

Barboza: Well, I think what's interesting about this is that it really is the state government developing a tool that is very much oriented toward what you would call environmental justice. But what's different with this is that actually, it's being done by a government agency, it does kind of put some pressure on those regulators to perhaps target those most polluted areas, those most impacted areas, for cleanup, for enforcement of environmental laws, for other investments. One thing that this is likely to be used for is investments from the state's cap-and-trade program to cut greenhouse gases. The governor has actually proposed in his upcoming budget to spend several hundred million dollars of those proceeds in disadvantaged communities, as required under the law.

Shafer: And it also, in a way, could put pressure on legislators who represent these districts where people are at most risk, to do something about it, to stand up for their constituents. Doesn't it?

Barboza: I think so. This tool, it has supporters among state and local elected officials who have been saying for a long time that some of their communities, particularly low-income, Latino communities, that they get short-shrift when it comes to resources and attention. I think what's important in understanding this is that when you look at this mapping effort, it really is a reflection of a new focus of how people are looking at the environment and how to solve environmental problems. With the example of air pollution, that's something that's gotten a lot better. But the places that have the worst air pollution are actually much more localized. There are these neighborhoods, small communities, little pockets of California where people have been left behind of that progress. This tool is making that all the more apparent and could perhaps put pressure on government officials to take targeted action to solve that.

More: New Interactive Map: How Polluted Is Census Tract Where You Live or Work?

lower waypoint
next waypoint
Cecil Williams, Legendary Pastor of Glide Church, Dies at 94Allegations of Prosecutorial Bias Spark Review of Death Penalty Convictions in Alameda CountyWhy Renaming Oakland's Airport Is a Big DealNurses Warn Patient Safety at Risk as AI Use Spreads in Health CareSF Democratic Party’s Support of Unlimited Housing Could Pressure Mayoral Candidates‘Sweeps Kill’: Bay Area Homeless Advocates Weigh in on Pivotal US Supreme Court CaseBay Area Indians Brace for India’s Pivotal 2024 Election: Here’s What to KnowSupreme Court Hears Oral Arguments in Major Homelessness CaseCalifornia’s Future Educators Divided on How to Teach ReadingWhen Rivers Caught Fire: A Brief History of Earth Day