upper waypoint

MAP: What California's Reservoir and Snowpack Levels Look Like Now

Save ArticleSave Article
Failed to save article

Please try again

Cars move slowly through flooded streets in the Northern California city of Ukiah in January 2017.  (Bob Dass/Flickr)

Drought? What drought?

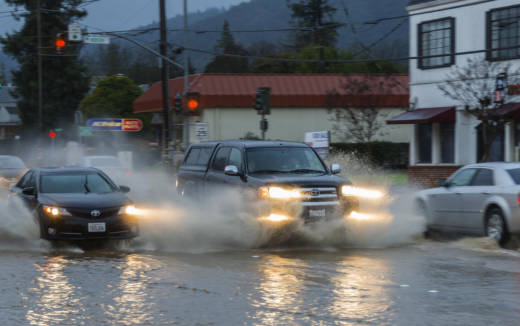
A series of powerful winter storms has restored California's once-withering snowpack to levels well above average, with most of the state's reservoirs now filled at or near capacity.

The suddenly swollen state of California's reservoirs made big news in mid-February when nearly 200,000 people living near Lake Oroville in Butte County were evacuated after the reservoir reached capacity and the dam's spillway failed.

The recent inundation of wet weather makes it's easy to forget that California was very recently mired in a historic five-year drought. And even while epic levels of rain and snow continue to pummel much of the state, the California Water Resources Control Board voted unanimously on Feb. 8 to extend current water conservation rules through September, a nod to the fickle weather patterns of recent years and the still diminished groundwater levels in areas of the agricultural-heavy Central Valley.

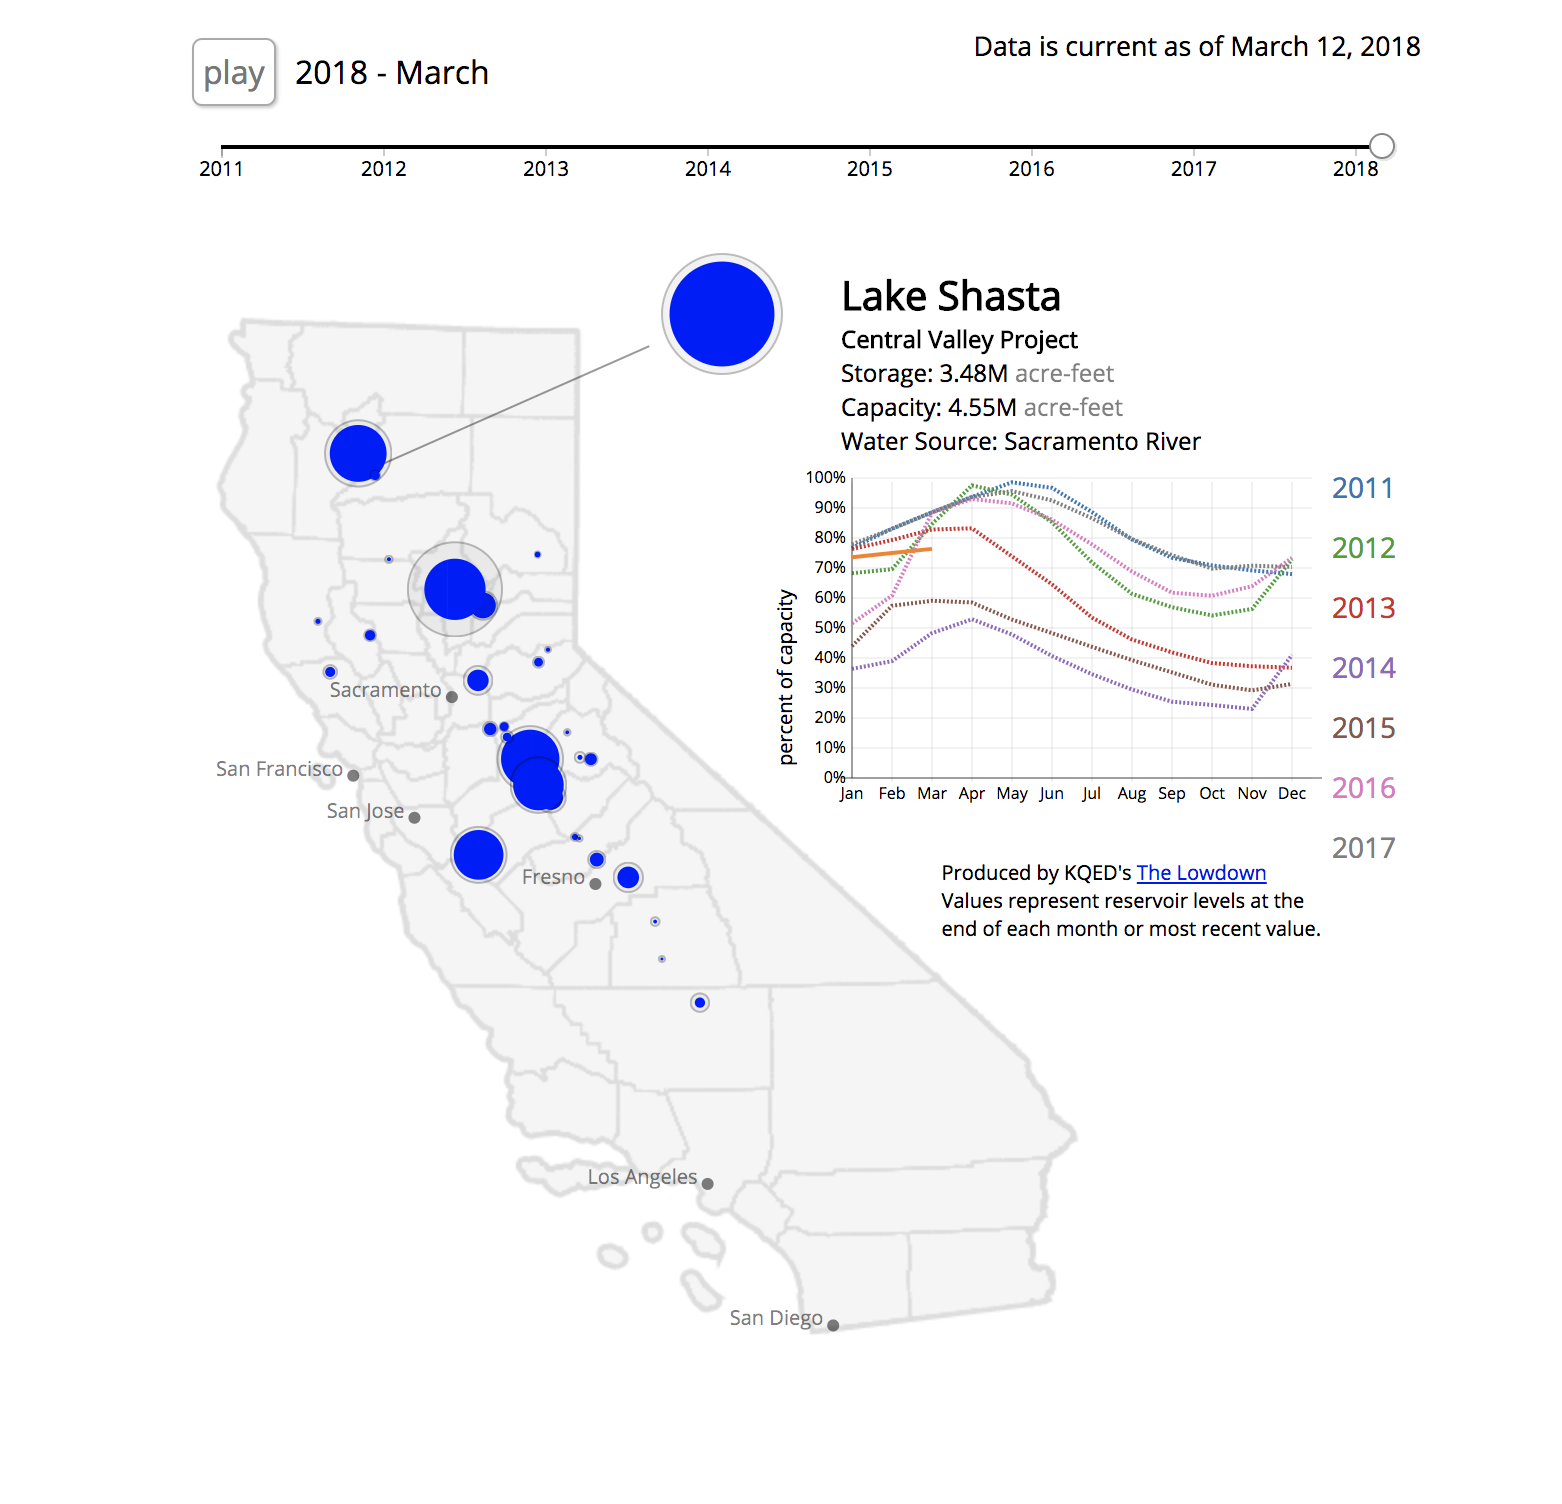
The map below shows fluctuations since 2010 in California's 30-largest reservoirs, using CA Department of Water Resources data.

Sponsored

Click on the reservoir map below to view the interactive version. Grey borders mark the maximum capacity of each reservoir, while the blue circles show fluctuating storage levels over time. All reservoirs are scaled relative to maximum storage capacity (with the largest -- Shasta Lake -- at 30 pixels). Click on each reservoir to see the change in capacity since 2010, and view changing percentages over time by mousing over the reservoir pop-out to the left of the chart.

Source: California Department of Water Resources

Major Bay Area water sources


key6

More on California's water sources

lower waypoint
next waypoint
Why So Many Central Americans Are Seeking Asylum in the U.S.Real-Time Interactive Earthquake Map: Get to Know Your Local FaultsIt's Really Happening! This Is What KQED's Youth Takeover Looks LikeWhen Rivers Caught Fire: A Brief History of Earth Day (with Lesson Plan)A Look Inside the Youth Vaping CrazeIt's Almost Tax Day. This Is How the Government Spends Your Hard-Earned CashIs the Endangered Species Act at Risk of Extinction?March Madness and the Money: Should College Athletes Get Paid?How to Stop a Nuclear War: The Non-Proliferation Treaty, ExplainedMAP: What Does the U.S.-Mexico Border Really Look Like?